Testimonials
Commissions
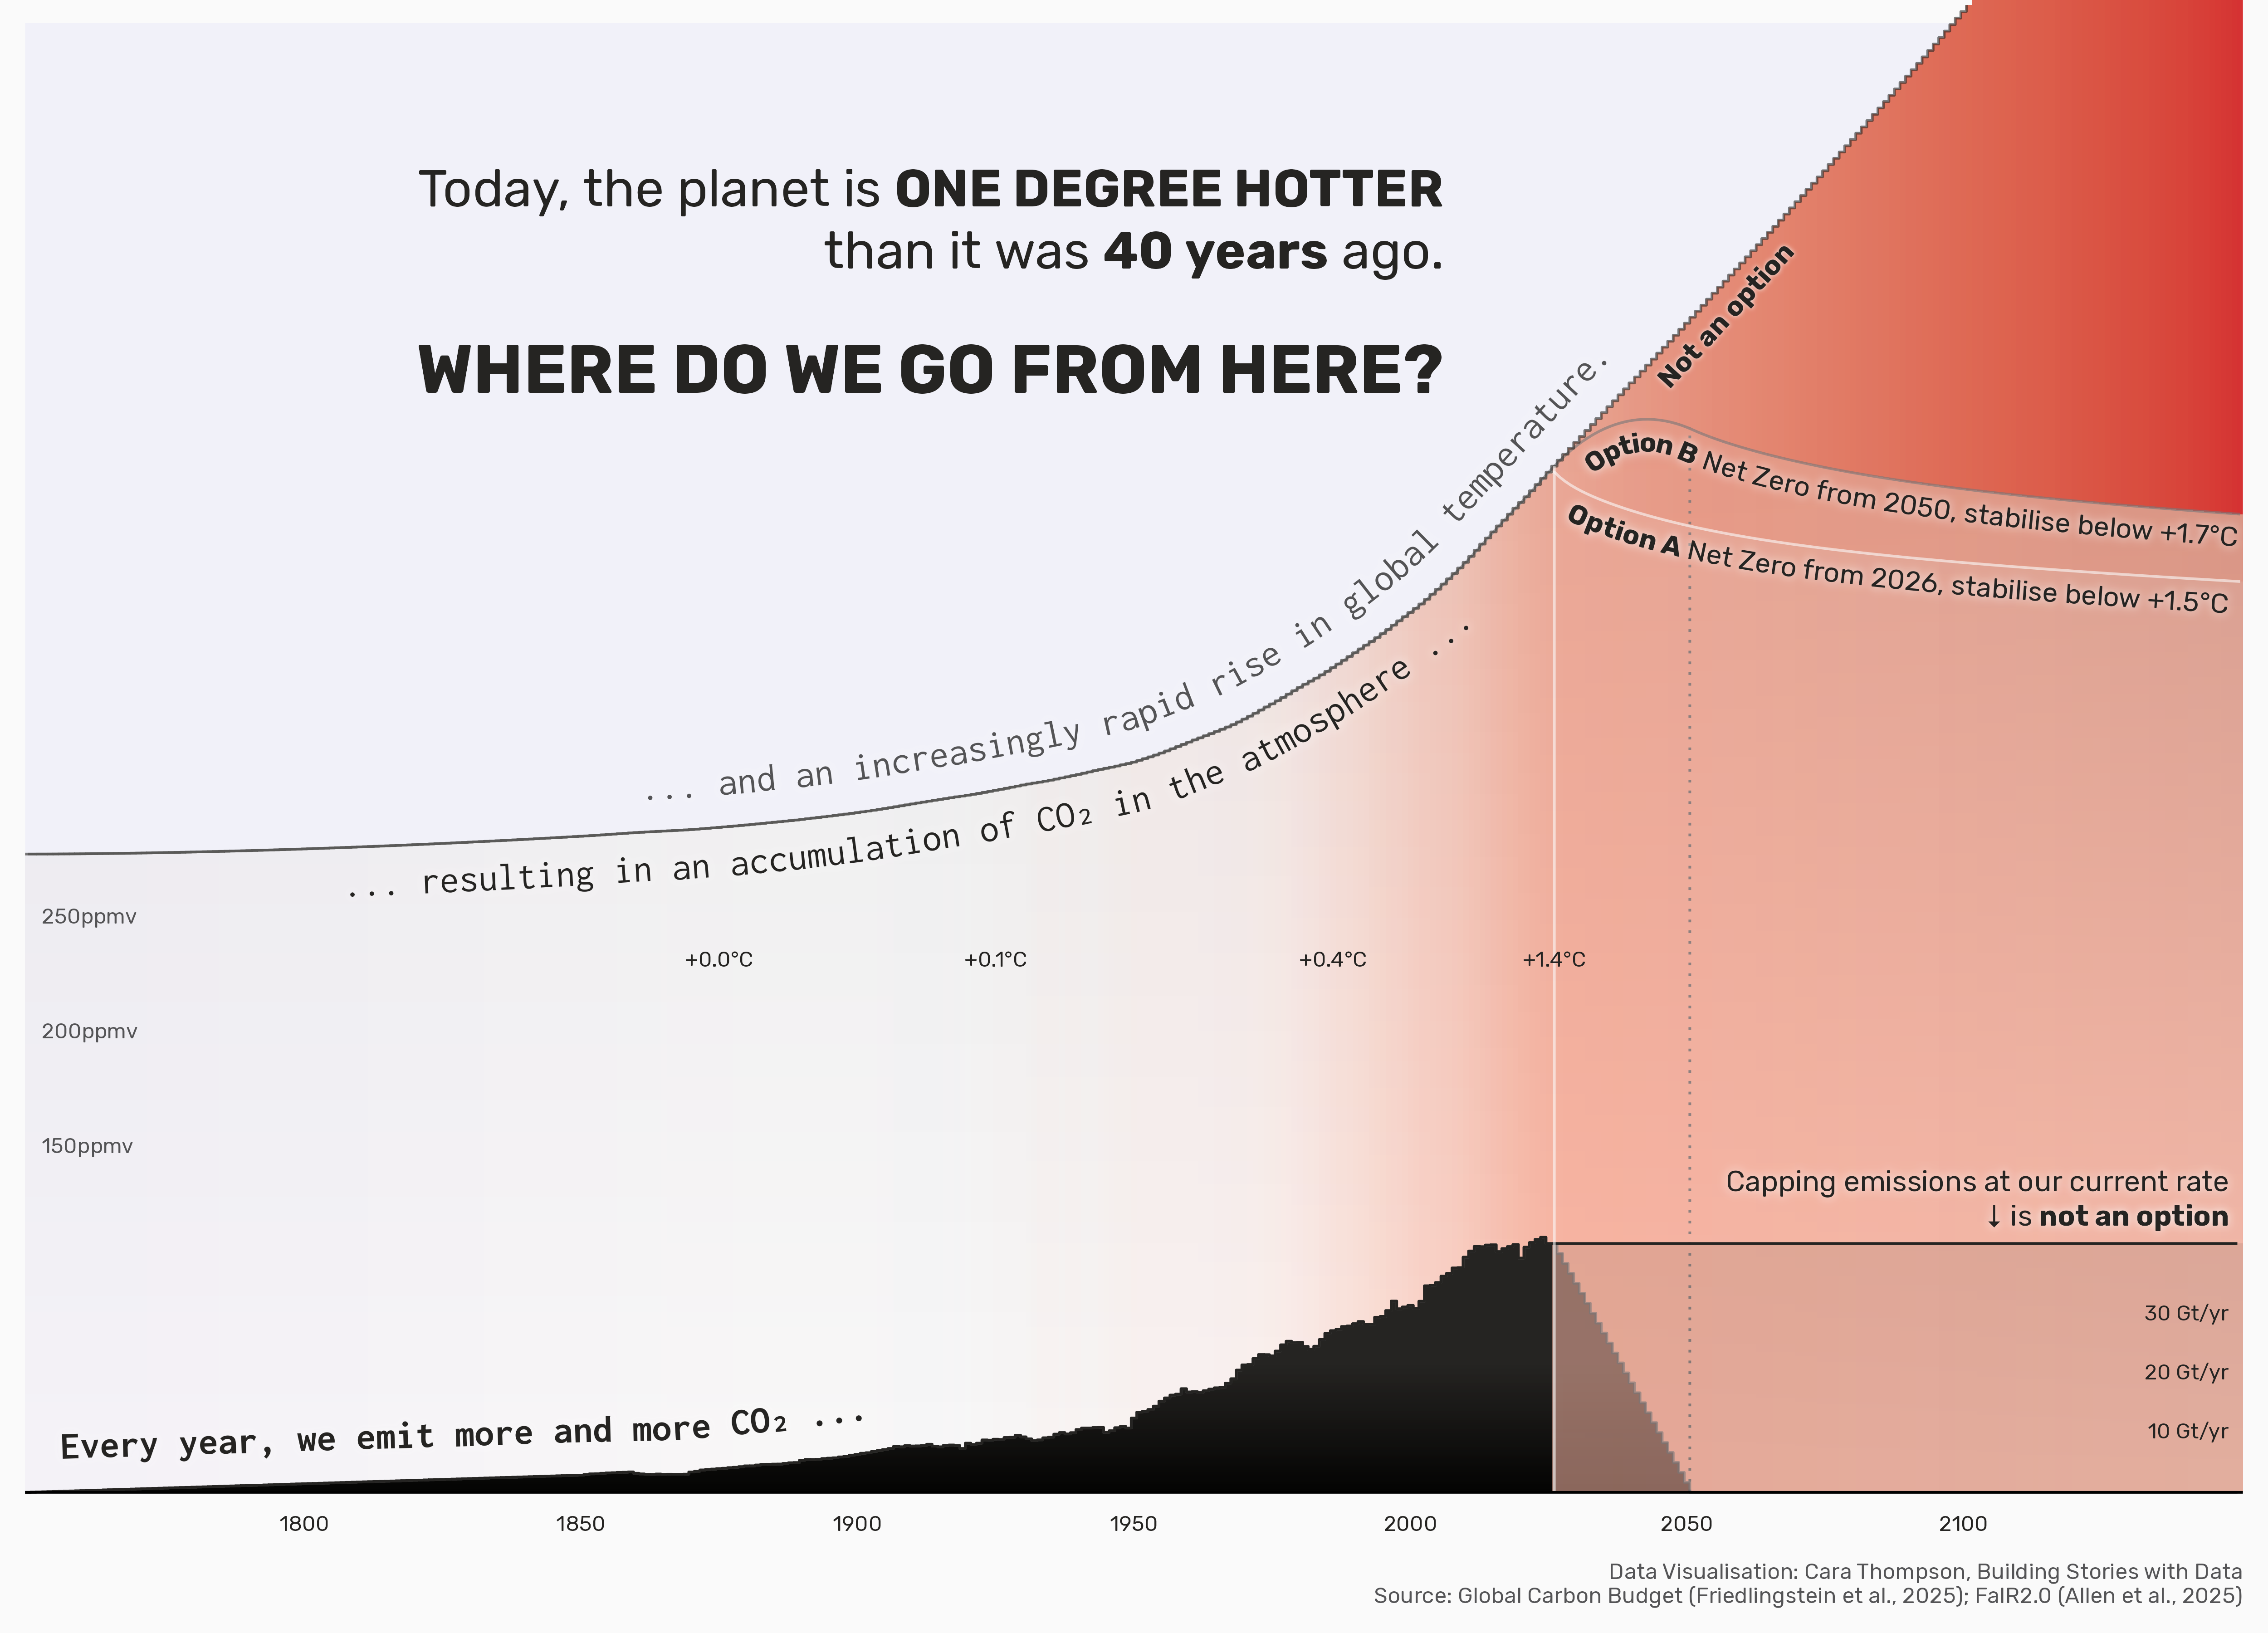
Cara has done a fantastic job, creating a very powerful visualisation of the CO₂ emissions-concentration-climate change relationship while keeping the scientific accuracy. It was a pleasure to work with her on this project.
Pierre Friedlingstein
Director of the Global Carbon Budget Office, Global System Institute
Cara is one of the most talented data viz designers in the R community. With a keen eye for aesthetics and serious skill to implement her visions through code, Cara creates high-quality data viz that is lovely to look at and communicates effectively.David Keyes
Founder at R for the Rest of Us
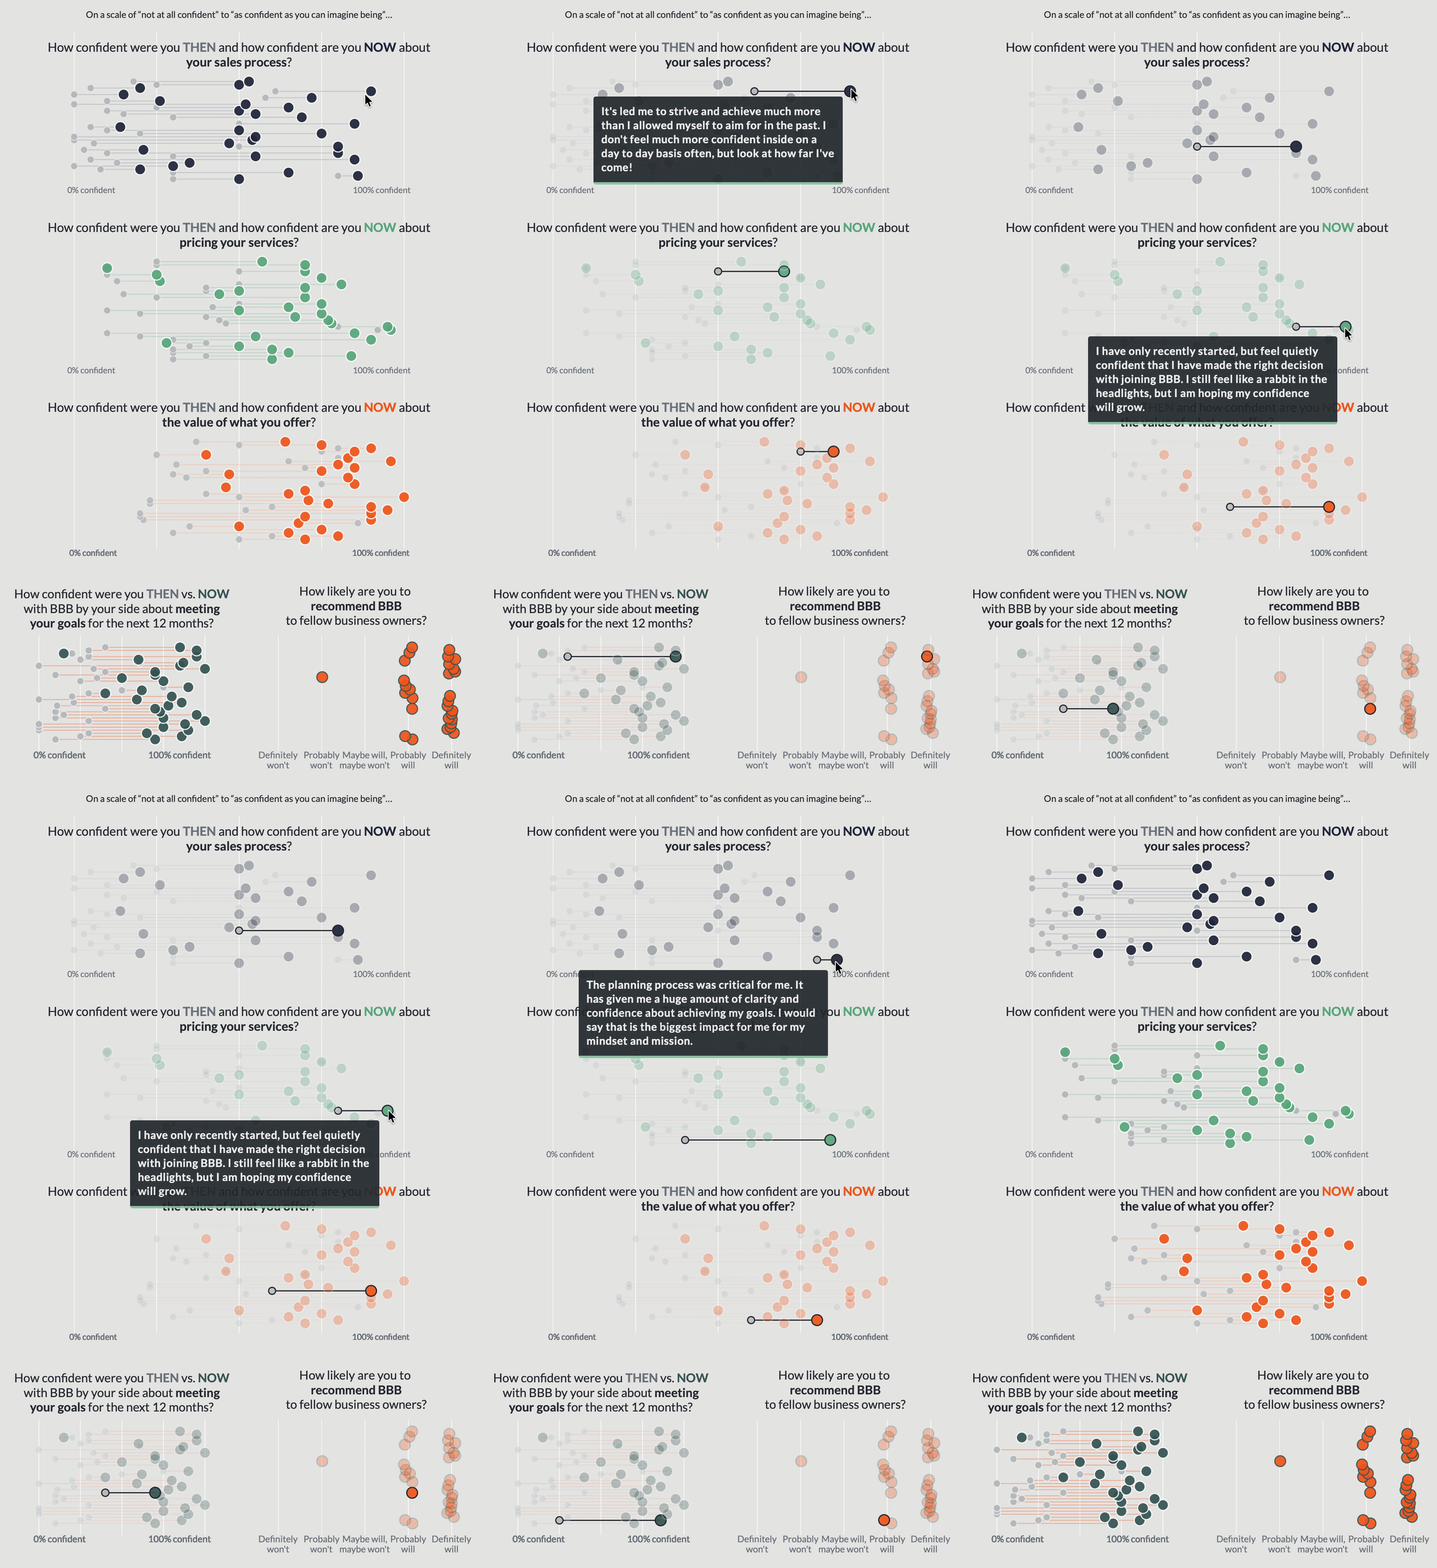
Cara was asked to work with a novel dataset - where there was no prior history of how we might visualize these - and to do this on very short notice. The process was collegial, and done not only on time, but on budget. What stands out was Cara’s ability to integrate the statistical nature of the data, the technical and administrative context, and the user’s needs, and then to user her mastery of R/ggplot2 to render something both functional and visually engaging.
Rob James
Founder at Evidently
Last week the VOX Scotland team took our report, Your Views: Psychiatrists in Scotland to the Scottish Parliament and met with Maree Todd MSP, the Minister for Social Care, Mental Wellbeing and Sport. We are so glad that we committed to this report and were able to produce something that has been, and will continue to be, so influential.
Natalie Stevenson
VOX Scotland
Thank you so much for all of your help with the graphs for the presentations. They have really helped us to present a professional image to the organisations that we are presenting to. It’s also helped us to clarify the information and communicate it in a clear way. Thank you so much.
Phil Thomas
Director at Transformation Leeds
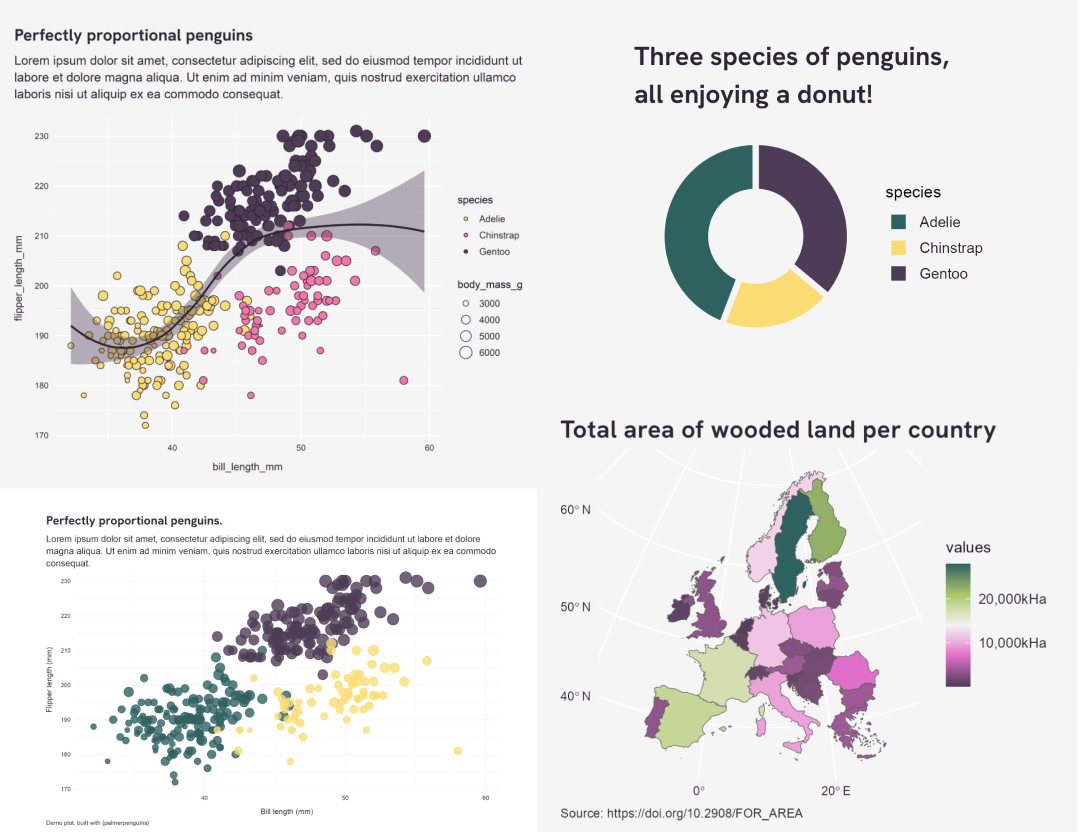
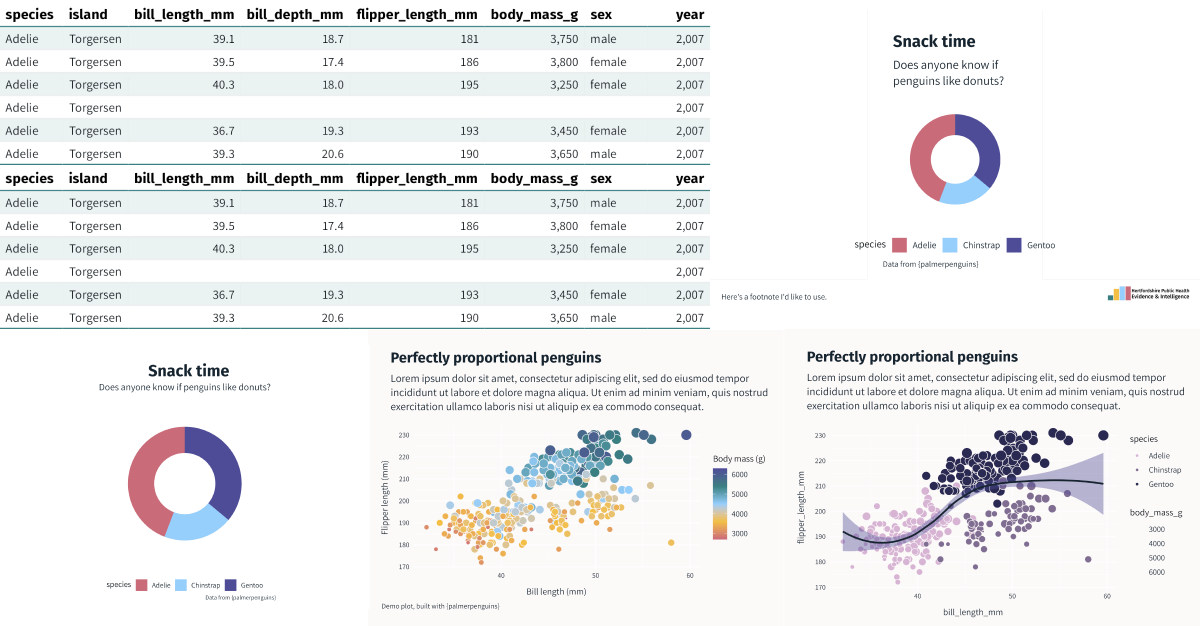
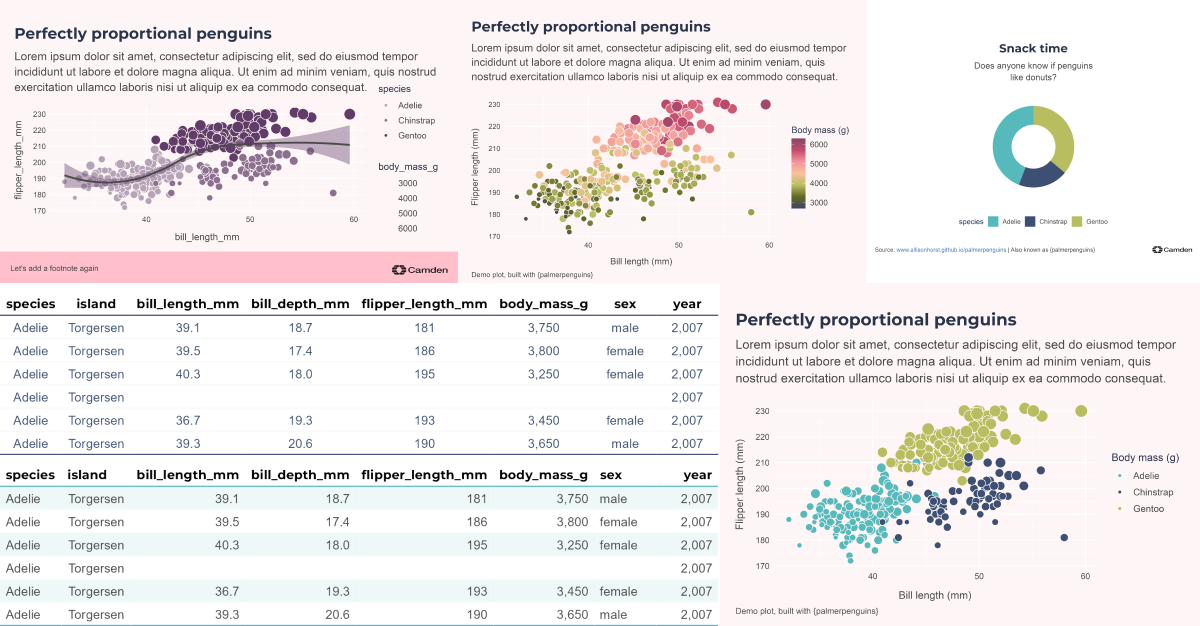
Dataviz design systems
 ”
”
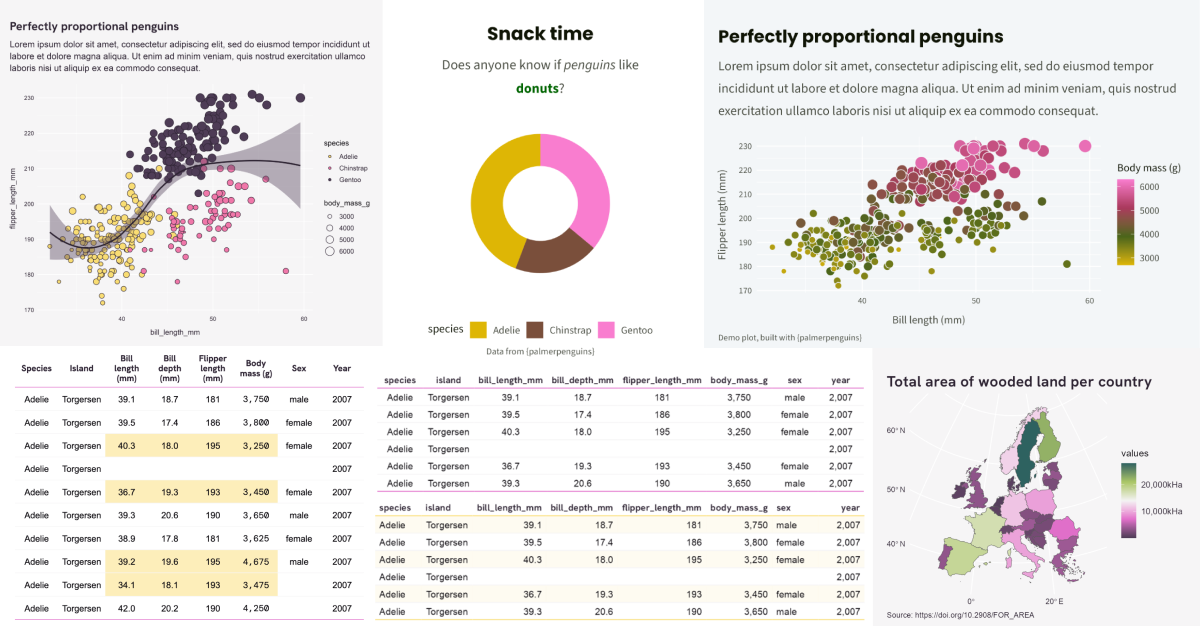
Cara helped me create a cohesive visual identity for my brand and implement it in an R package. It’s provided immediate value to my work by dramatically reducing the time needed to go from a good idea to a professional-quality data visualization output. Cara has been great to work with.
Teal Emery
Founder & Lead Researcher, Teal Insights
What Cara’s work has given us is the foundation of a coherent visual ‘language’ rooted in the department’s identity and ‘brand’ as something distinct from the university as a whole — the library has improved the quality of output from those of us who had already adopted these FOSS frameworks and created an incentive for those still relying on proprietary software (such as PowerPoint) to switch over. So we’re expecting gains in terms of openness, reproducibility, and quality.
Cara managed the entire process very effectively so that it was one less thing on my plate. She quickly grasped the brief, understood what we were trying to achieve, and then ‘got on with the job’, sharing key milestones/deliverables and producing the codebase on time. For other data-driven organisations the obvious benefit is the capacity to quickly deliver a visually consistent and coherent set of outputs (from charts to reports) that remain essentially data-driven.
Jon Reades
Prof. of Geographic Data Science & Head of Department at CASA UCL
We needed an expanded colour palette with some clear guidelines on how to use it to convey meaning and maintain the brand ‘feel’. Cue Cara Thompson. She built us a data viz guide and recently spent a day with the analyst team… helping us upskill in building stories with data. It was both inspiring and practical - Cara helped us dig into the real message we want to convey with our graphs and charts and introduced us to some really cool tools to help us bring those messages to life.
If your organisation works with data and wants to move with the times, ensuring things like accessibility while also exploring interactivity, or if you just have a five-colour palette that needs expanding into a coherent set of storytelling hues, I highly recommend reaching out to Cara.
Anna Ali
Communications and Advocacy Manager at Regen
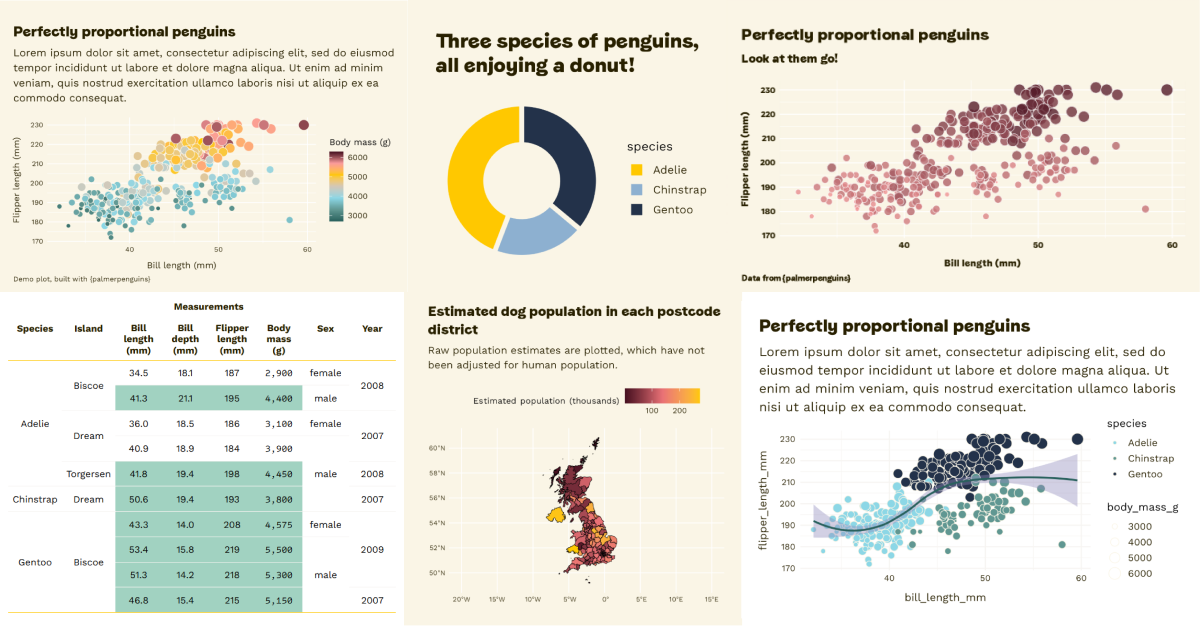
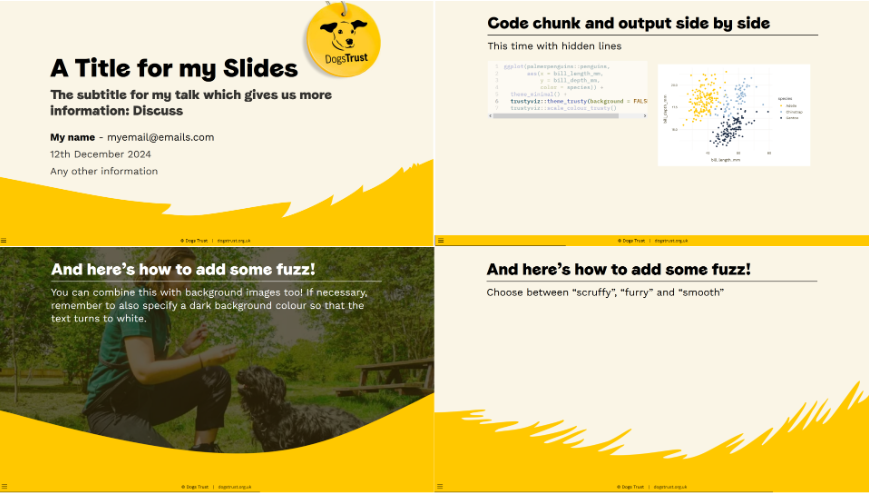
Our organisation has long had visual branding guidelines, but these focus on presentations, animations and graphics, and what rules they did have for charts were liable to produce visualisations that were poorly accessible, and possibly misleading. Cara worked with us to produce a series of colour palettes for a range of our dataviz use cases, wrapped up in ggplot themes in an R package that also included implementations of our other visual assets as Markdown/Quarto templates.
Cara was brilliant to work with, and produced a final product that did exactly what we needed whilst remaining true to the organisation’s guidelines. The final system is robust, flexible and easy to use, and it’s been amazing to see how quickly it has been adopted across our team of 25+ people.Ben Cooper
Senior Data Officer at the Dogs Trust
Training and workshops
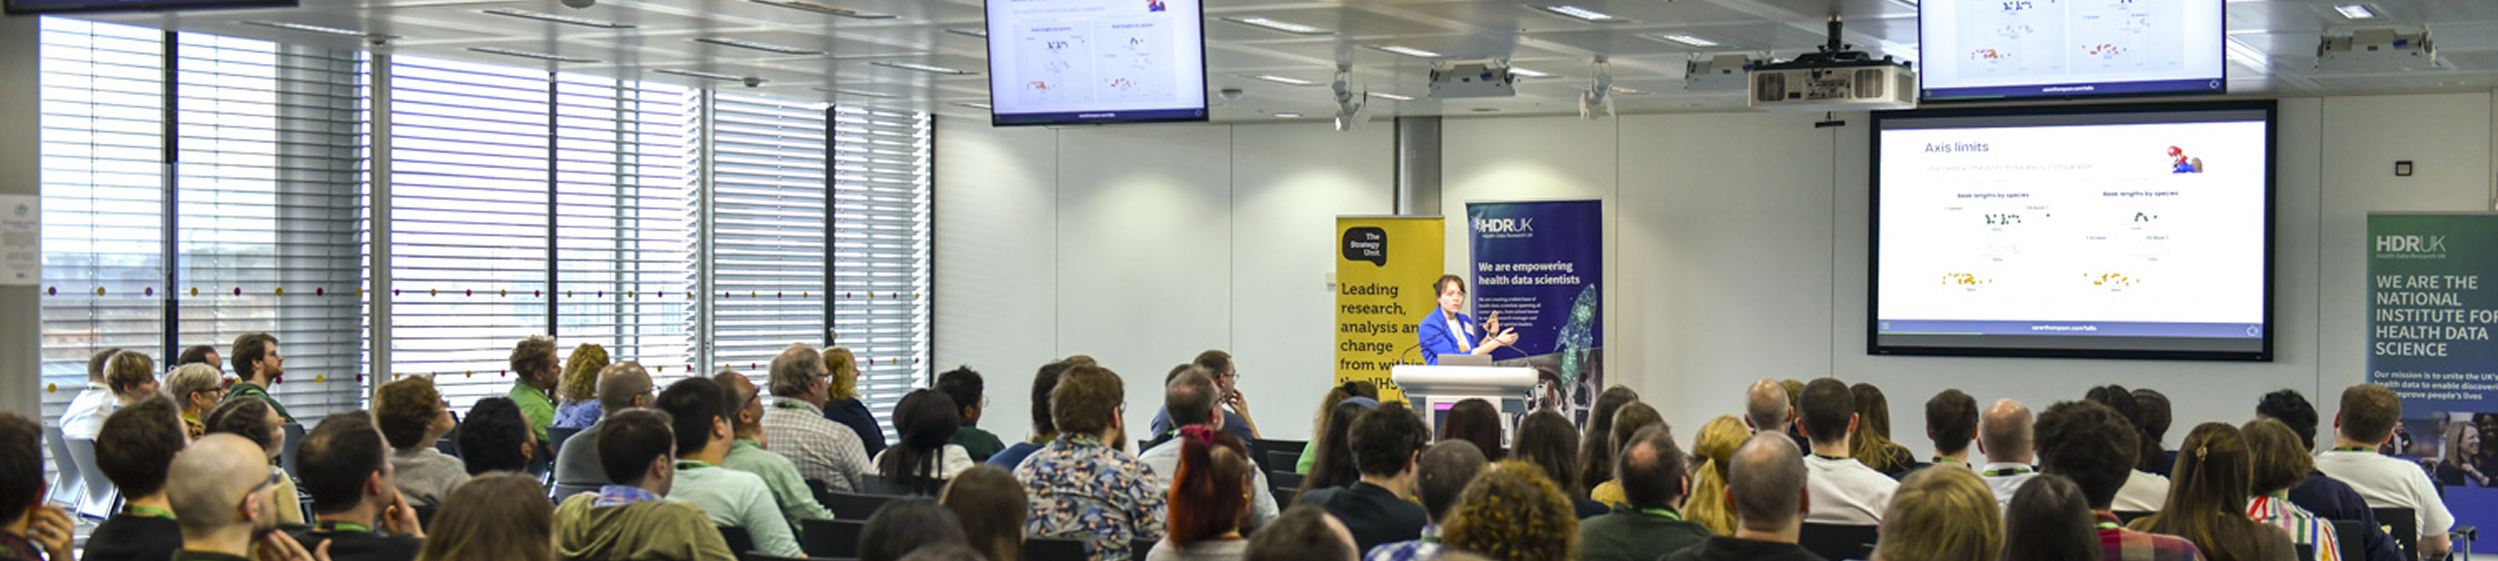
I really liked Cara’s way of teaching. She was incredibly engaging and made everything interactive. I always felt that if I did need to ask a question, she would be happy to answer. For only one day, I thought she taught us so much, but it did not feel overwheling.
Marina Lewis
Principal Manager at Planning and Performance at Natural England
I attended your workshop last week “Level up your plots” as part of the NHS R course and found it really useful! I have been telling my colleagues how good it was and now they’re all keen to watch it!
Dr. Francesca Baylis
Analyst Manager, Kent Analytics
I just wanted to re-iterate my thanks for a fantastic and thought-provoking workshop today. The content of the session was extremely engaging and I’m sure we will have all taken away some valuable learning, which we can apply to improve the quality and impact of our various reporting products and analytical outputs going forward.
It was also really great to be able to bring our analytical teams together, with the structure of the day facilitating a good level of energy and interaction between colleagues both in the room and online.
Barry Stockton-Tate
Assistant Director - Commissioning Data & Analytics at NHS England
The way I approach data visualisation has definitely changed and there are more steps I go through before I even get into coding. I think more about accessibility, colour schemes, key messages etc. My coding skills, especially when it came to data viz were very basic beforehand. This course really has given me more confidence in exploring different options and being more ‘creative’ with the visuals, which, especially working in academia, can feel quite daunting.
Critical Decade Researcher at the University of East Anglia