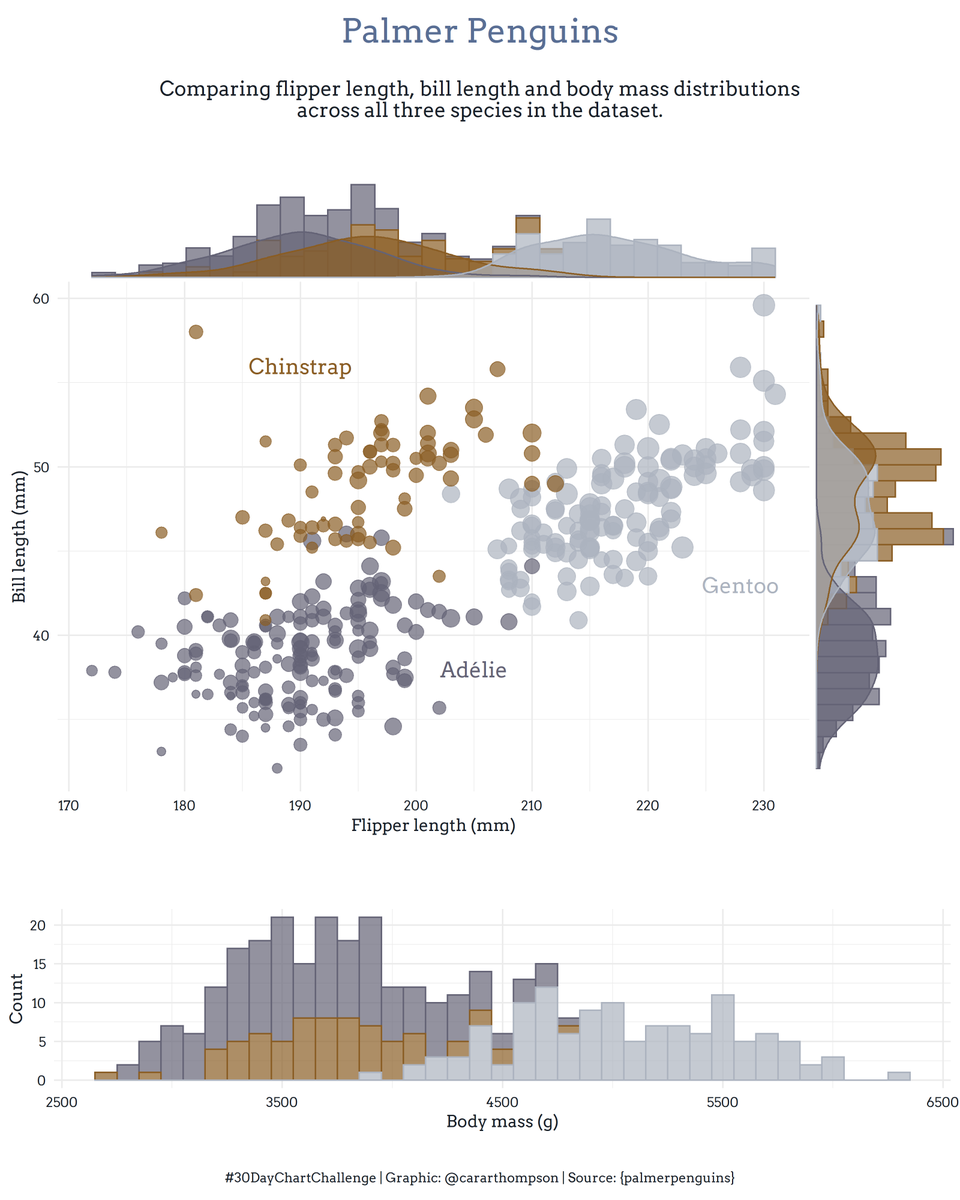
#30DayChartChallenge - Day 8: Distributions | Animals
{ggExtra} and direct annotations
#30DayChartChallenge - Day 8: Distributions | Animals
Gave 📦{ggExtra} a try for some “densigrams” along the axes. Made the plot look quite busy so I tried to pare back as much of the rest of it as I could.
- 🔧: #rstats, with 📦{palmerpenguins} 🐧🐧🐧
Code: github.com/cararthompson/30DayChartChallenge/blob/main/sc…
Any strong feelings on clarifying colours with labels inside the plot rather than with a legend? I really like a direct annotation!
Reuse
Citation
For attribution, please cite this work as:
Thompson, Cara. 2021. “#30DayChartChallenge - Day 8: Distributions
| Animals.” April 8, 2021. https://www.cararthompson.com/posts/2021-04-08-x30day-chart-challenge-day-8-distributions/.
