#30DayChartChallenge - Day 11: Distributions | Circular
data-visualisation
annotations
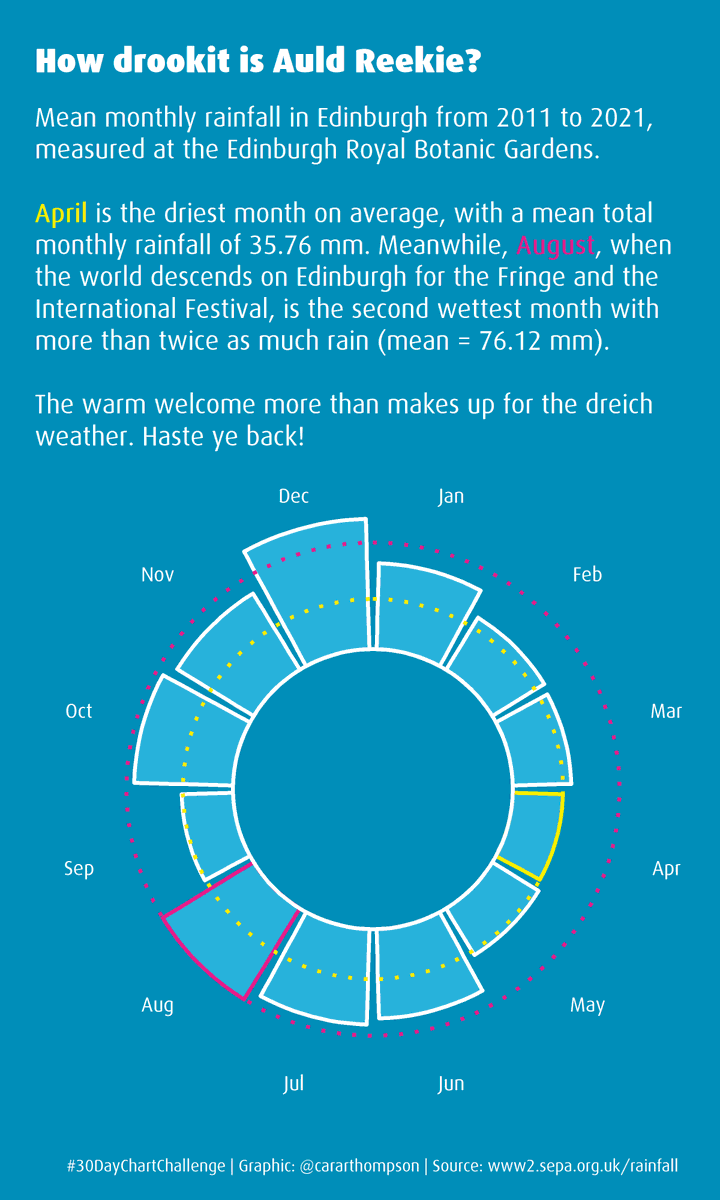
Visualising rain data in Edinburgh with an aesthetic borrowed from the festival
Data from ScottishEPA and aesthetics inspired by edfringe
Reuse
Citation
For attribution, please cite this work as:
Thompson, Cara. 2021. “#30DayChartChallenge - Day 11:
Distributions | Circular.” April 11, 2021. https://www.cararthompson.com/posts/2021-04-11-x30day-chart-challenge-day-11-distributions/.