#30DayChartChallenge - Day 12: Distributions | Strips
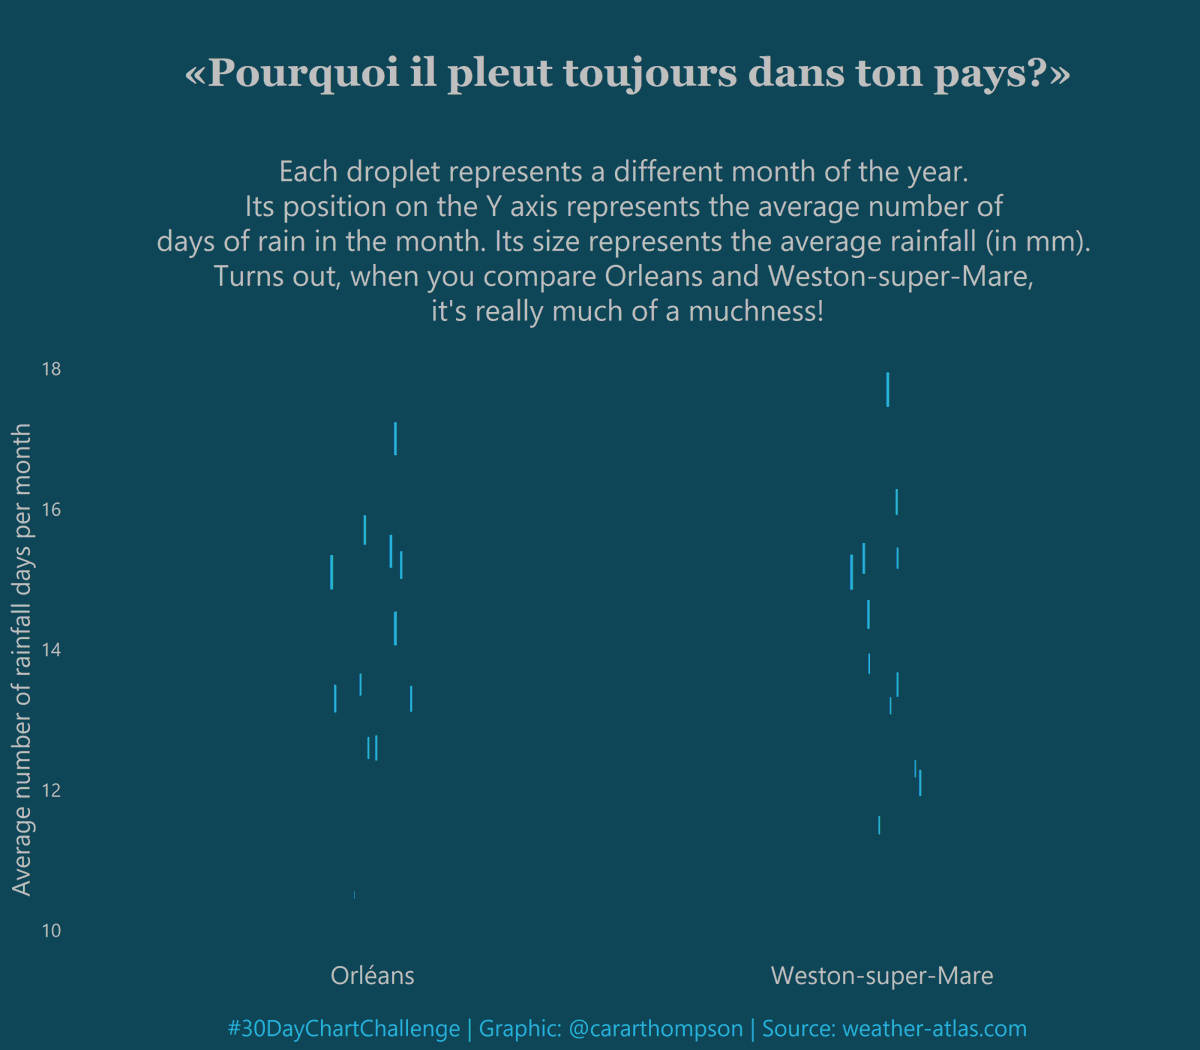
More rain data, but with an international comparison this time!
This one is in memory of a particularly soggy school trip from Orléans (France) to Weston-super-Mare (UK).
Had fun going from the data to the plot with nothing in the Environment.
Reuse
Citation
For attribution, please cite this work as:
Thompson, Cara. 2021. “#30DayChartChallenge - Day 12:
Distributions | Strips.” April 12, 2021. https://www.cararthompson.com/posts/2021-04-12-x30day-chart-challenge-day-12-distributions/.
