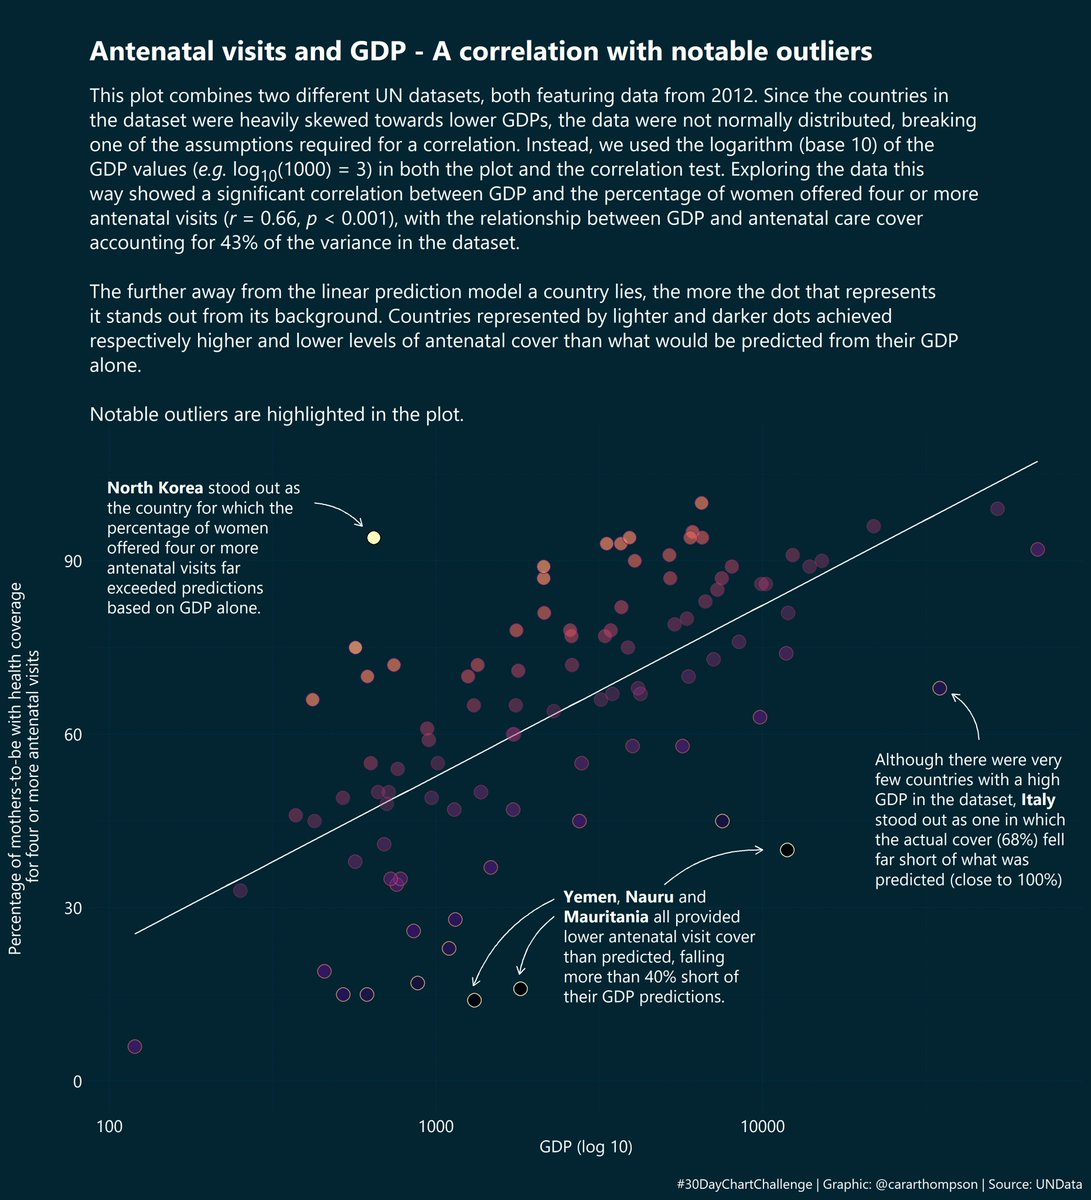
#30DayChartChallenge - Day 13: Relationships | Correlation - Exploring antenatal care and GDP
An annotated correlation using UNData, highlighting a few important outliers
- Data: UNdata
- 🔧: #rstats
- 💡: I explored several ways of highlighting datapoints which didn’t fit with predictions. The arrows were super fiddly on a log scale, but worth it I think!
Code: github.com/cararthompson/30DayChartChallenge/blob/main/sc…”
Reuse
Citation
For attribution, please cite this work as:
Thompson, Cara. 2021. “#30DayChartChallenge - Day 13:
Relationships | Correlation - Exploring Antenatal Care and GDP.”
April 13, 2021. https://www.cararthompson.com/posts/2021-04-13-x30day-chart-challenge-day-12-relationships/.
