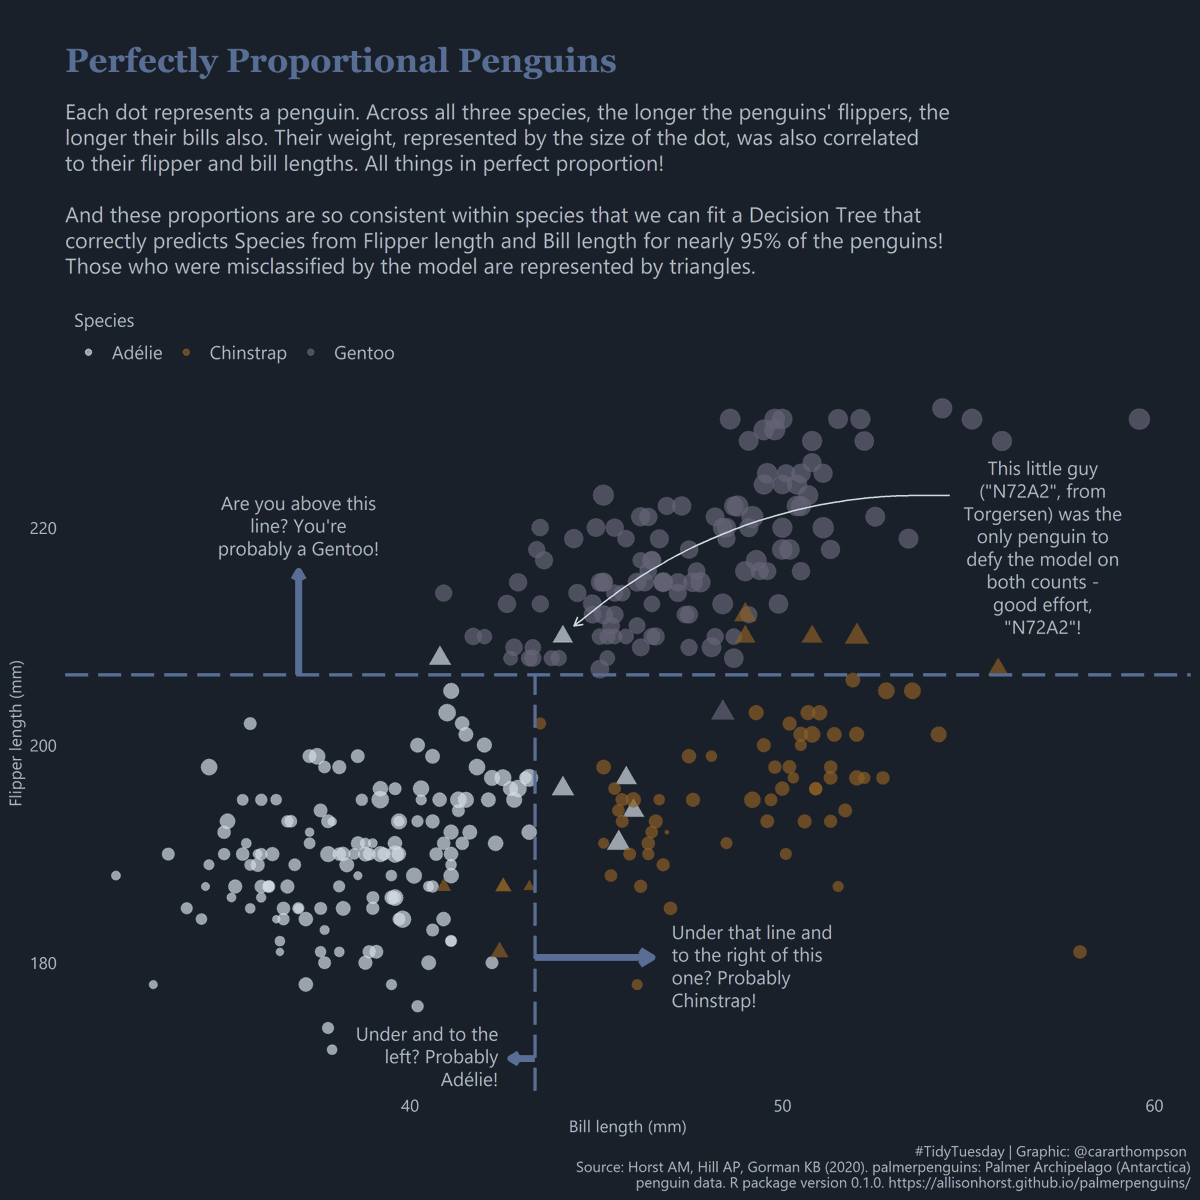
#30DayChartChallenge - Day 16: Relationships | Trees
After yesterday’s marathon effort, I’m taking a shortcut today and recycling another of my #TidyTuesday contributions in which I used machine learning on the {palmerpenguins} dataset to illustrate Decision Trees.
 📦: 🐧🐧🐧
Reuse
Citation
For attribution, please cite this work as:
Thompson, Cara. 2021. “#30DayChartChallenge - Day 16:
Relationships | Trees.” April 16, 2021. https://www.cararthompson.com/posts/2021-04-16-x30day-chart-challenge-day-16-relationships/.