"

#30DayChartChallenge - Day 20: Time series | Upwards

Recycling another
Author
Affiliation

Building Stories with Data

Published

April 20, 2021

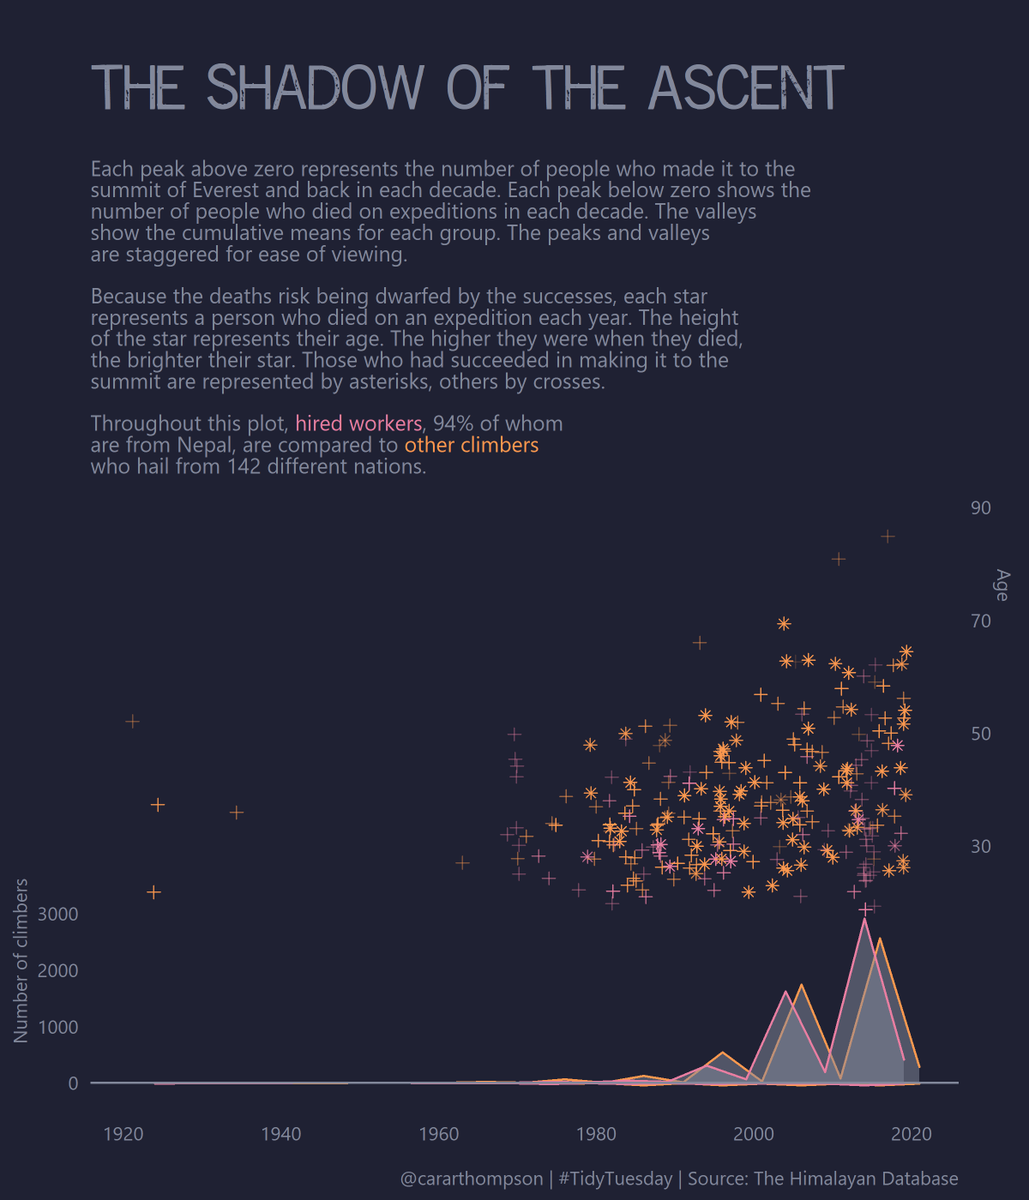
Dark-themed visualisation titled 'The Shadow of the Ascent,' showing decades of Mount Everest climbers. Peaks above zero indicate successful summits; valleys show cumulative means. Stars represent climber deaths, sized by age. Differentiates hired workers and other climbers.

Reuse

Citation

For attribution, please cite this work as:
Thompson, Cara. 2021. “#30DayChartChallenge - Day 20: Time Series | Upwards.” April 20, 2021. https://www.cararthompson.com/posts/2021-04-20-x30day-chart-challenge-day-20-time/.