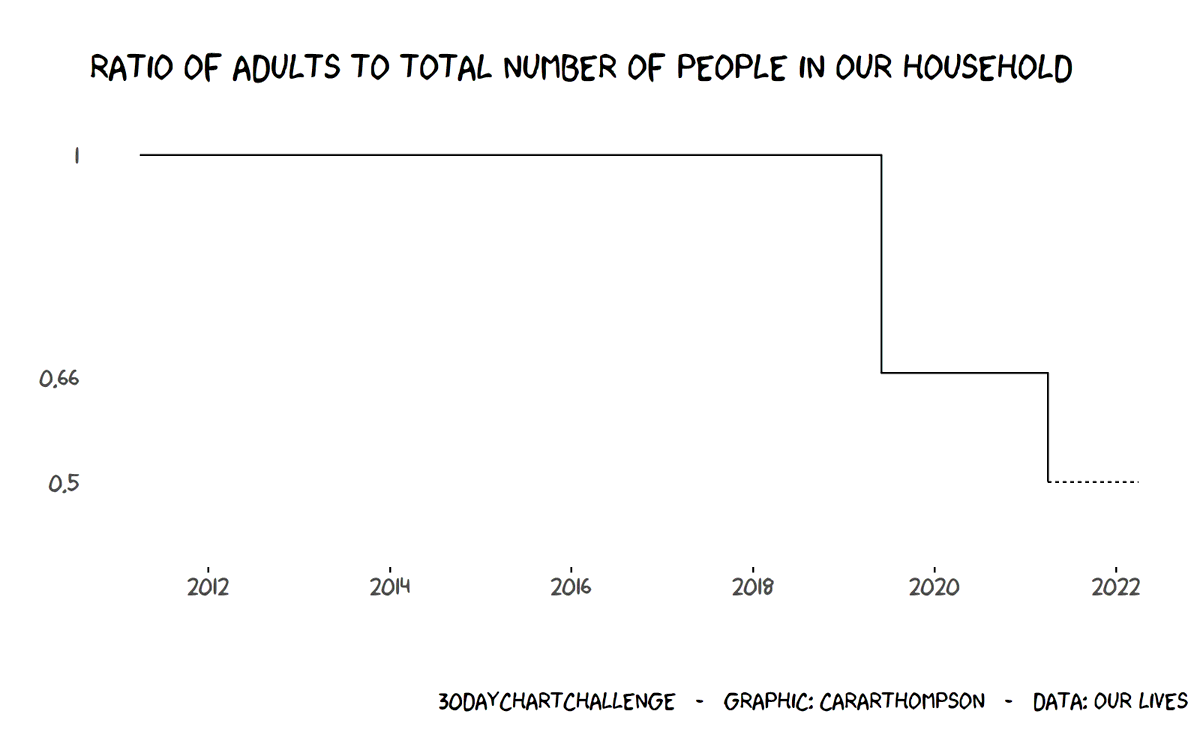
#30DayChartChallenge - Day 21: Time series | Downwards
data-visualisation
data-art
storytelling
Keeping things simple today to try to get ahead as the shift to 0.5 is imminent,🤞!
- 🔧: #rstats
- 📦: {xkcd}
- 💻: github.com/cararthompson/30DayChartChallenge/blob/main/sc…
Reuse
Citation
For attribution, please cite this work as:
Thompson, Cara. 2021. “#30DayChartChallenge - Day 21: Time Series
| Downwards.” April 21, 2021. https://www.cararthompson.com/posts/2021-04-21-x30day-chart-challenge-day-21-time/.