Accessibility in dataviz
data-visualisation
r-how-to
ggplot2
Finally got a chance to catch up with MineDogucu’s #user2022 talk on accessibility. Some great tips within a wide-ranging framework, from making resources open and accessible to using example data on a range of topics to coding tips.
TIL
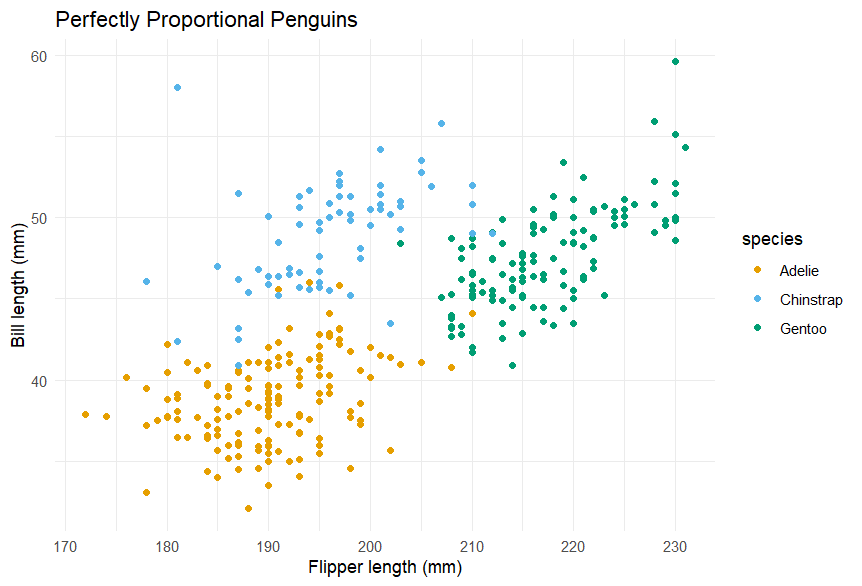
fig.alt=""andfig.cap=""scale_colour_OkabeIto()👇
Reuse
Citation
For attribution, please cite this work as:
Thompson, Cara. 2022. “Accessibility in Dataviz.” July 13,
2022. https://www.cararthompson.com/posts/2022-07-13-finally-got-a-chance-to/.