# Create factor labels with markdown subscript tags
df %>%
  mutate(
    element = factor(
      element,
      levels = c("K", "P", "Ca", "Mg", "S", "Fe", "Mn"),
      labels = c(
        "K<sub>2</sub>O",
        "P<sub>2</sub>O<sub>5</sub>",
        "Ca",
        "Mg",
        "S",
        "Fe",
        "Mn"
      )
    )
  )

# Allow the plot to read them using ggtext's element_markdown
plot +
  facet_wrap(
    . ~ element,
    ncol = 1,
    scales = "free_y",
    strip.position = "left"
  ) +
  theme(
    strip.background = element_rect(color = "orange", fill = "orange"),
    strip.text.y.left = ggtext::element_markdown(
      color = "white",
      angle = 0,
      face = "bold"
    )
)Formatting subscripts using 📦{ggtext}’s element_markdown()
data-visualisation
r-how-to
Another fun annotation trick within the same plot!
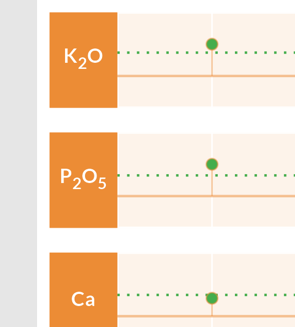
Here’s the relevant bit of the plot with the relevant bit of code.
Thanks ClausWilke for a great package. Most of my plots make use of some {ggtext} function or another!
Reuse
Citation
For attribution, please cite this work as:
Thompson, Cara. 2022. “Formatting Subscripts Using 📦{Ggtext}’s
Element_markdown().” August 31, 2022. https://www.cararthompson.com/posts/2022-08-31-another-fun-annotation-trick-within/.