Visualise, Optimise, Parameterise! New code-along workshop video
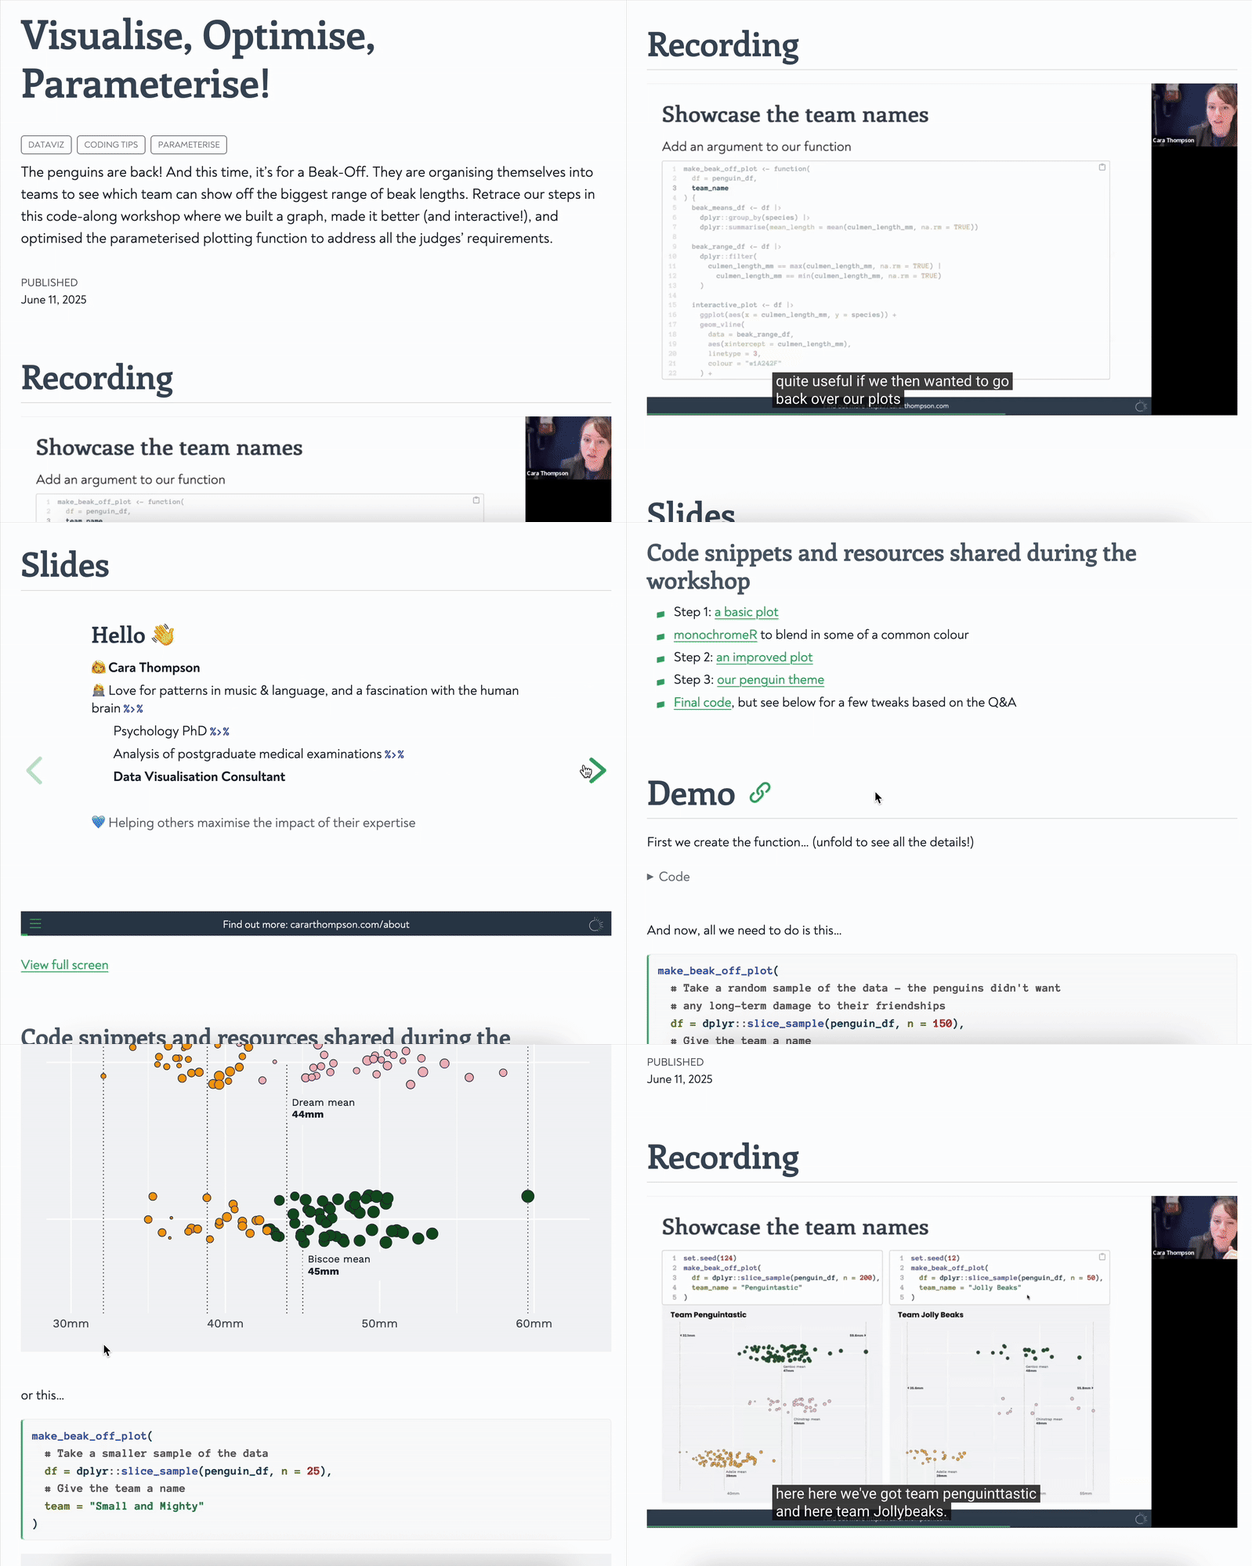
The video for my Visualise, Optimise, Parameterise workshop at #RMedicine2025 is now up on my website.
I’ve been chatting to a few folks about creating parameterised plot functions for their teams. It’s something I really enjoy doing: figure out the best way to visualise the data for the end users, provide a ggplot-based function that allows us to create the same plot time and time again with different data, save everyone hours of copy-pasting / manual plot tweaking (and the associated code maintenance nightmare!); repeat for the next plot they need to make time and time again for regular reports and presentations.
In the workshop, we worked through the traps I’ve typically encountered in creating these parameterised plotting functions, and how to avoid them. There was even one that came up in the workshop preparation! Part of the fun of creating these functions is that it forces you to evaluate your code for imprecisions - what goes wrong when you feed in new data? How could you specify what the function should do better in order to avoid that?
Recording + slides + resources + the final code for the parameterised function 👉 www.cararthompson.com/talks/visualise-optimise-parameterise/
