Services
I offer a range of solutions to help individuals and organisations harness the power of data visualisation to maximise the impact of their expertise. Whether through training, collaborating, or crafting something for you, the aim is always the same: clients feeling confident that they can use data visualisations to communicate important patterns in their data in a way that will engage their desired audience.
Dataviz Design Systems
It’s provided immediate value to my work by dramatically reducing the time needed to go from a good idea to a professional-quality data visualization output. Cara has been great to work with.
Teal Emery • Founder & Lead Researcher of Teal Insights
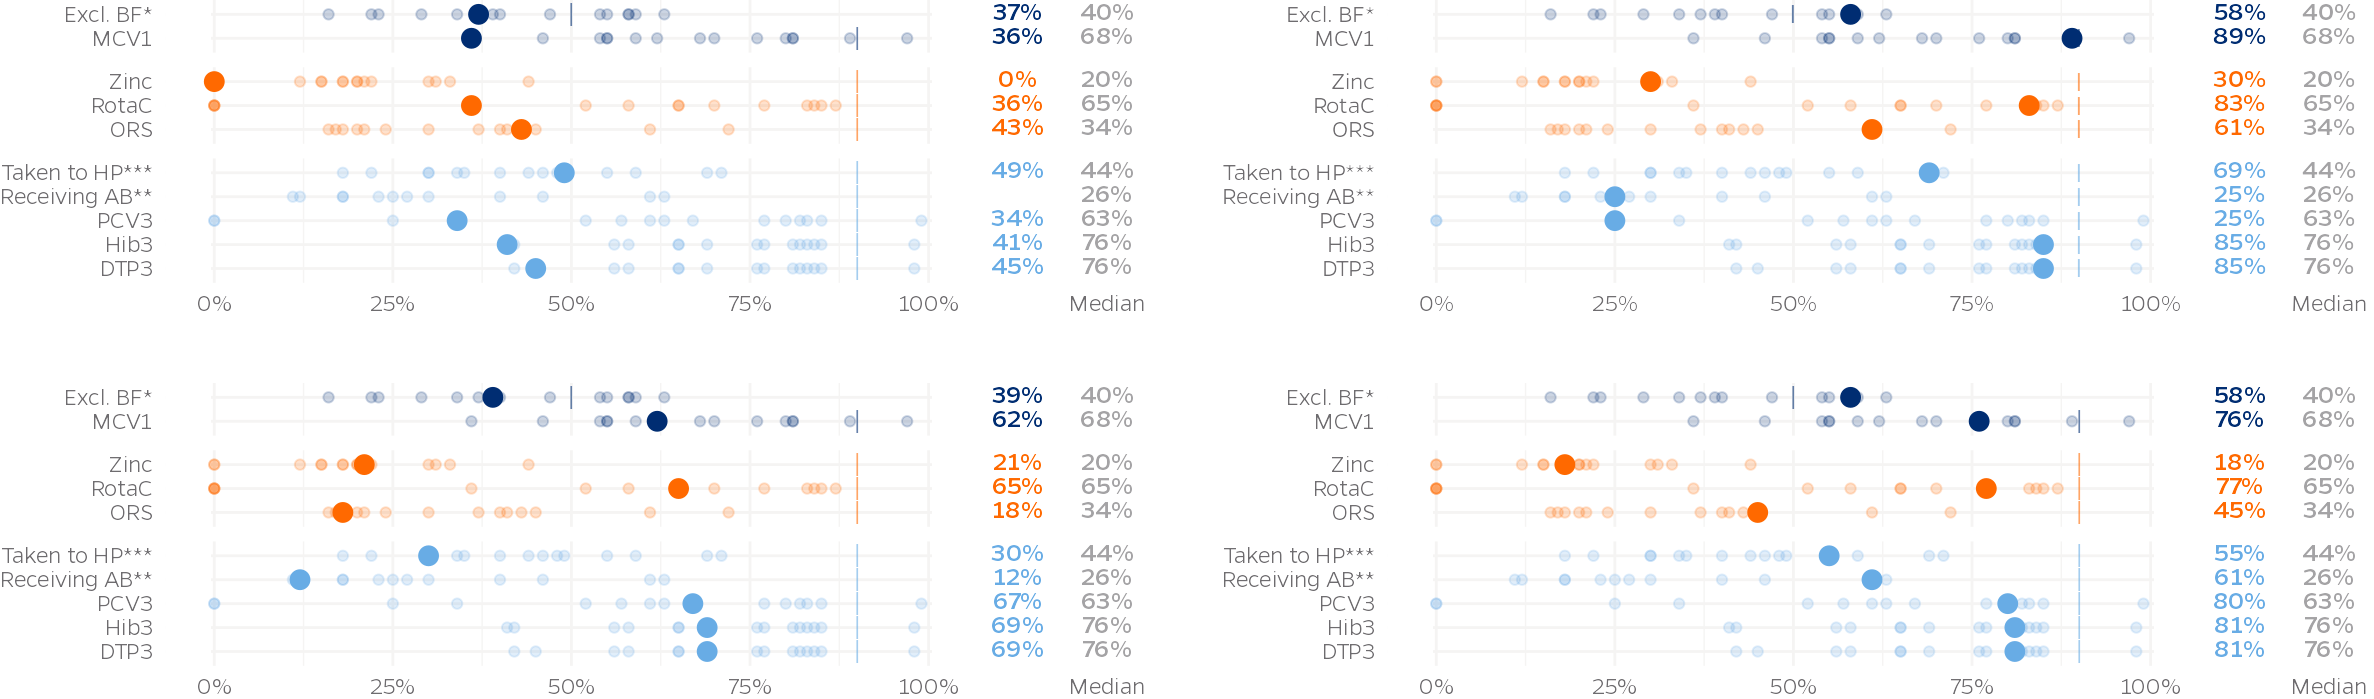
A dataviz design system is a bespoke set of colours, fonts, and rules, which can be combined to create data visualisations with a consistent aesthetic, taking into account colour semantics, accessibility, and design principles to help the stories in the data stand out. Investing in a dataviz design system for your team also brings about aesthetic unity, ensuring a clear visual identity across authors, papers, reports and conference talks.
Implemented as a fully documented bespoke R package with a robust test suite, as an Excel Add-on or as a PowerBI theme, the aim of the system is to save you time in decision making and implementation, so that you can focus on the aspects of data analysis and graph creation where your expertise adds most value.
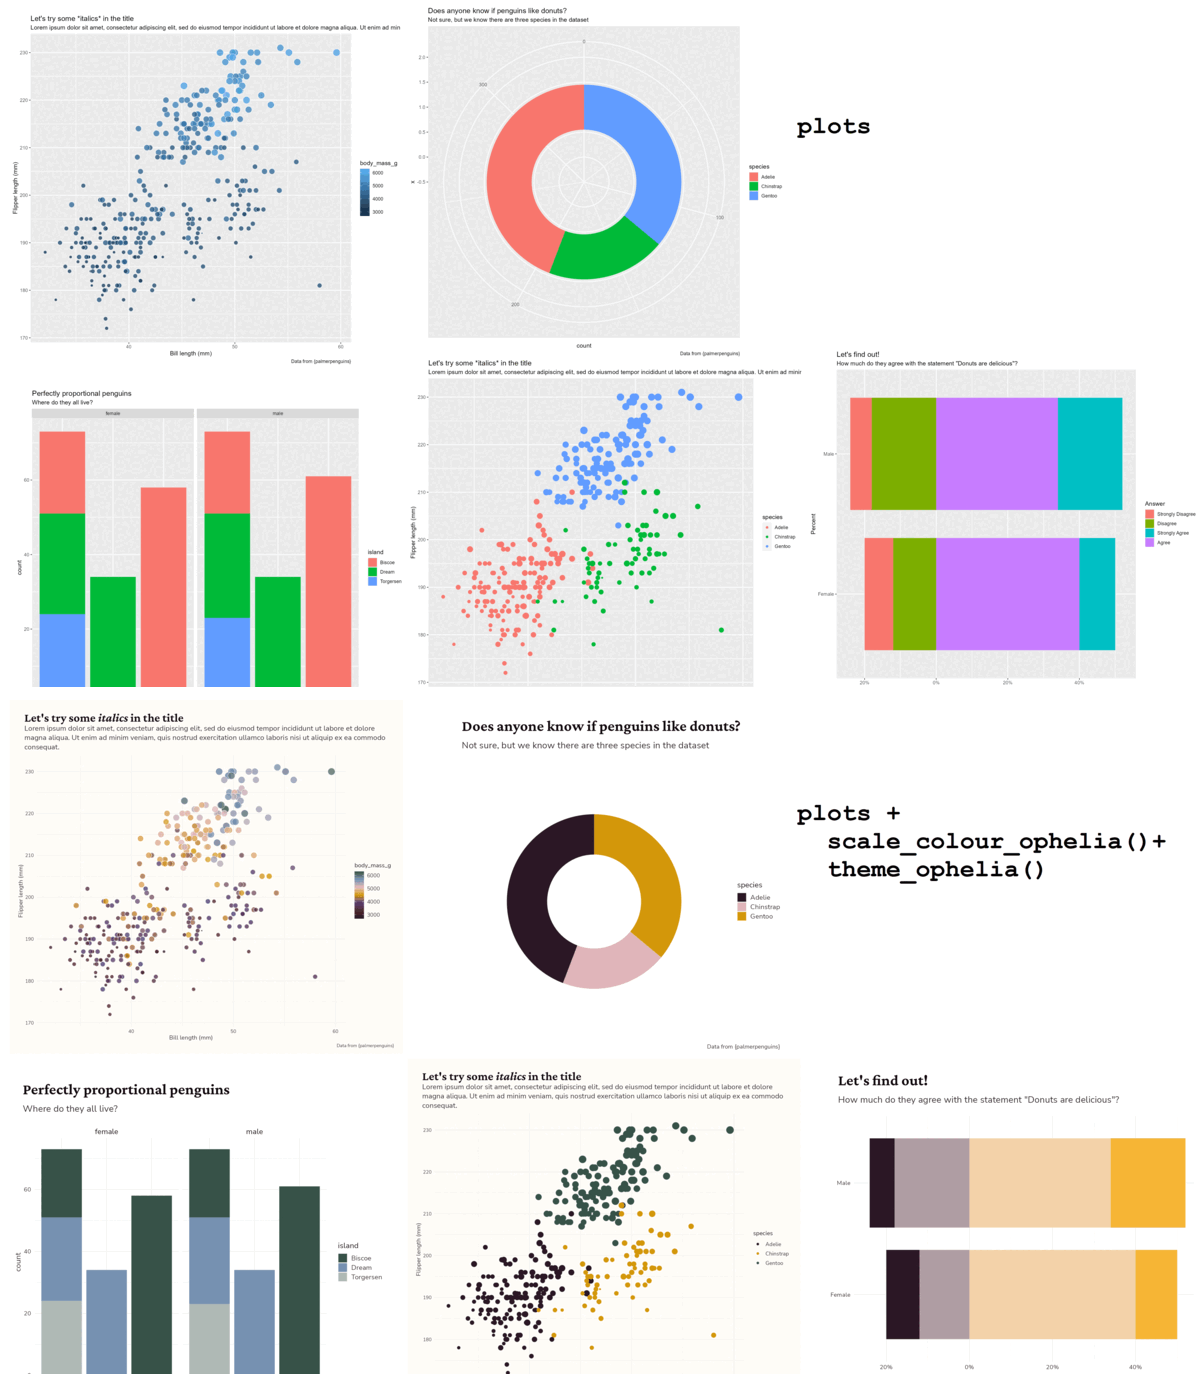
These are one of my favourite things to create, combining creativity with constraints to help data-driven teams maximise the visual impact of their work. I recently spoke at RMedicine about the process involved in creating a dataviz design system for a medical research group; you can rewatch the talk below. Want to see a few more examples? 👉 This way!
Data-to-viz Commissions
What stands out was Cara’s ability to integrate the statistical nature of the data, and the user’s needs, and then to use her mastery of R/ggplot2 to render something both functional and visually engaging.
Rob James • Founder of Evidently
You have some data to present, and your audience wants to understand it. Whether you’re looking for crystal clear communication of data insights, an artistic response to the data, or something in between the two, I enjoy putting together stand-out visuals which will keep the conversation going about your work.
From academic graphs to artistic commemorations, via interactive visualisations and animations with a sense of humour, my portfolio features a range of different styles, all coded straight from the data.
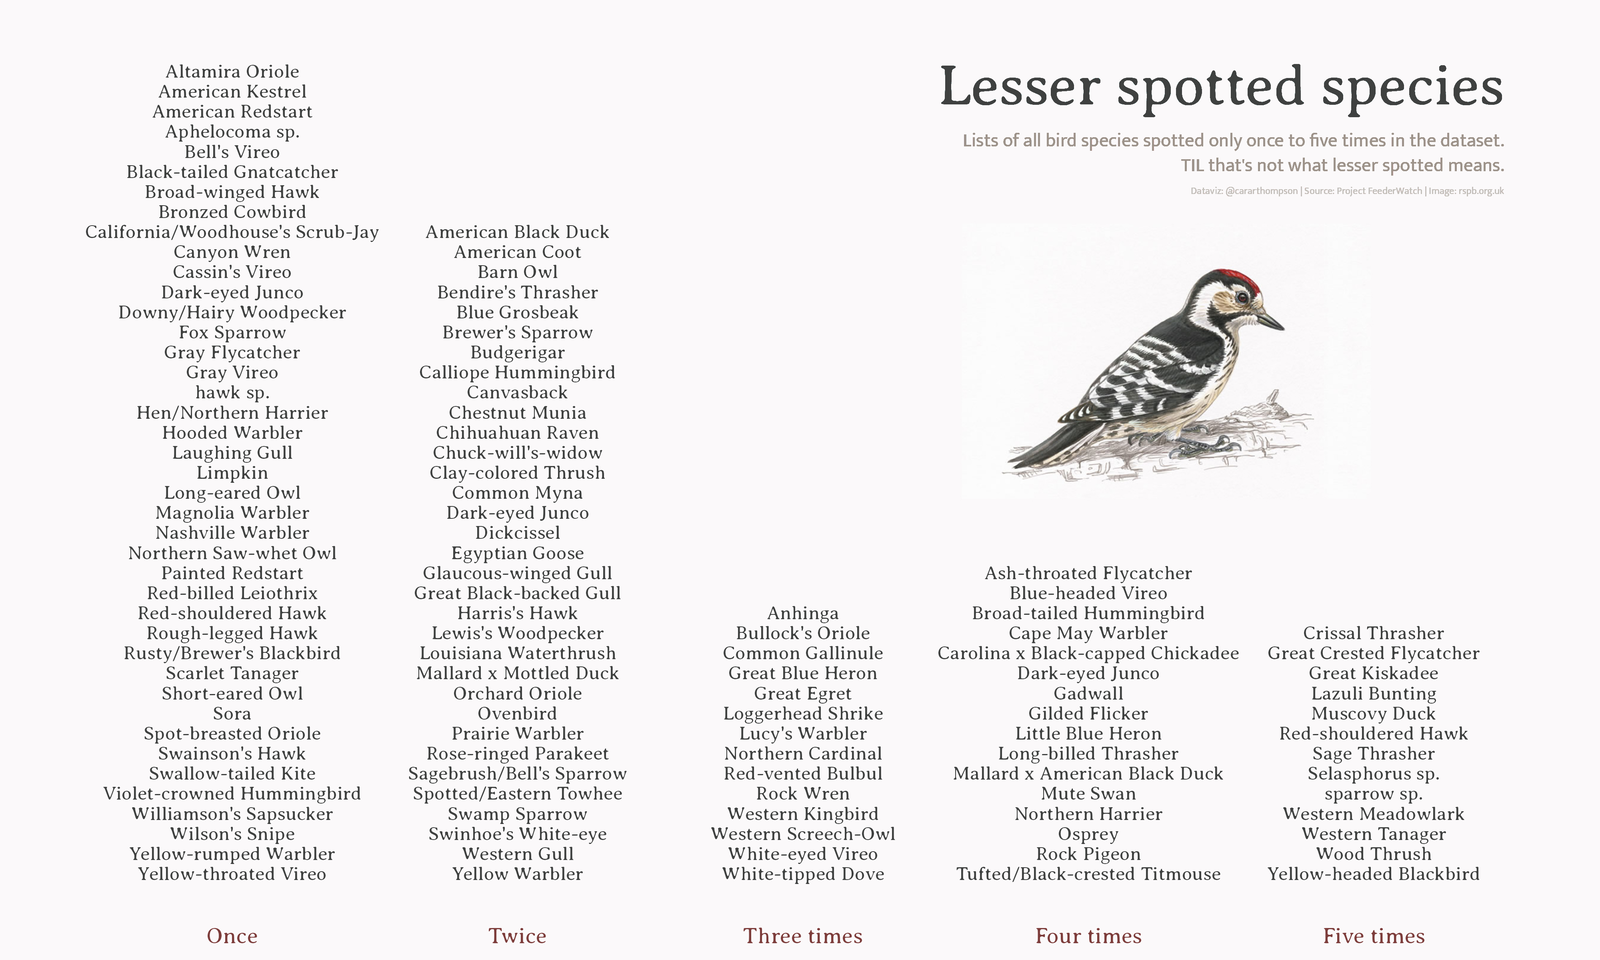
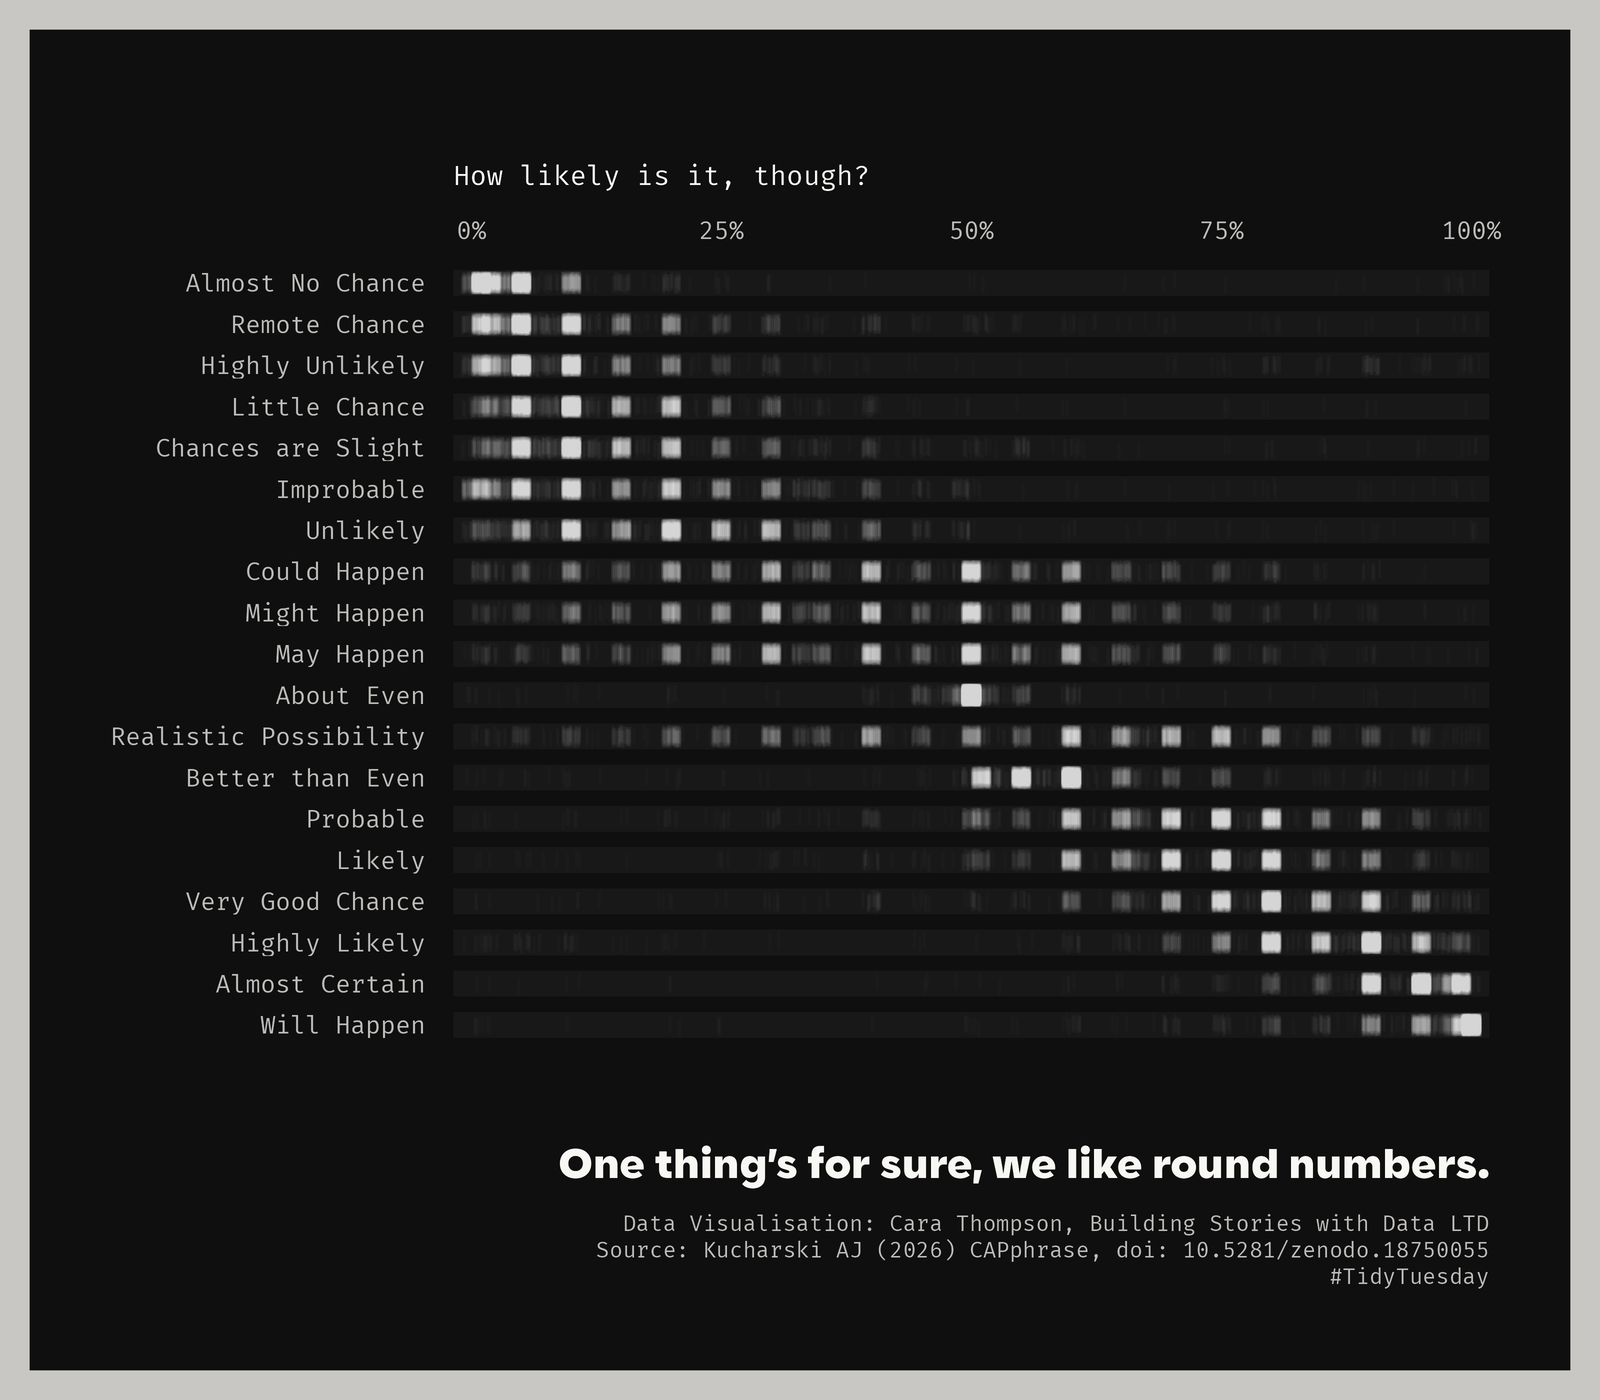
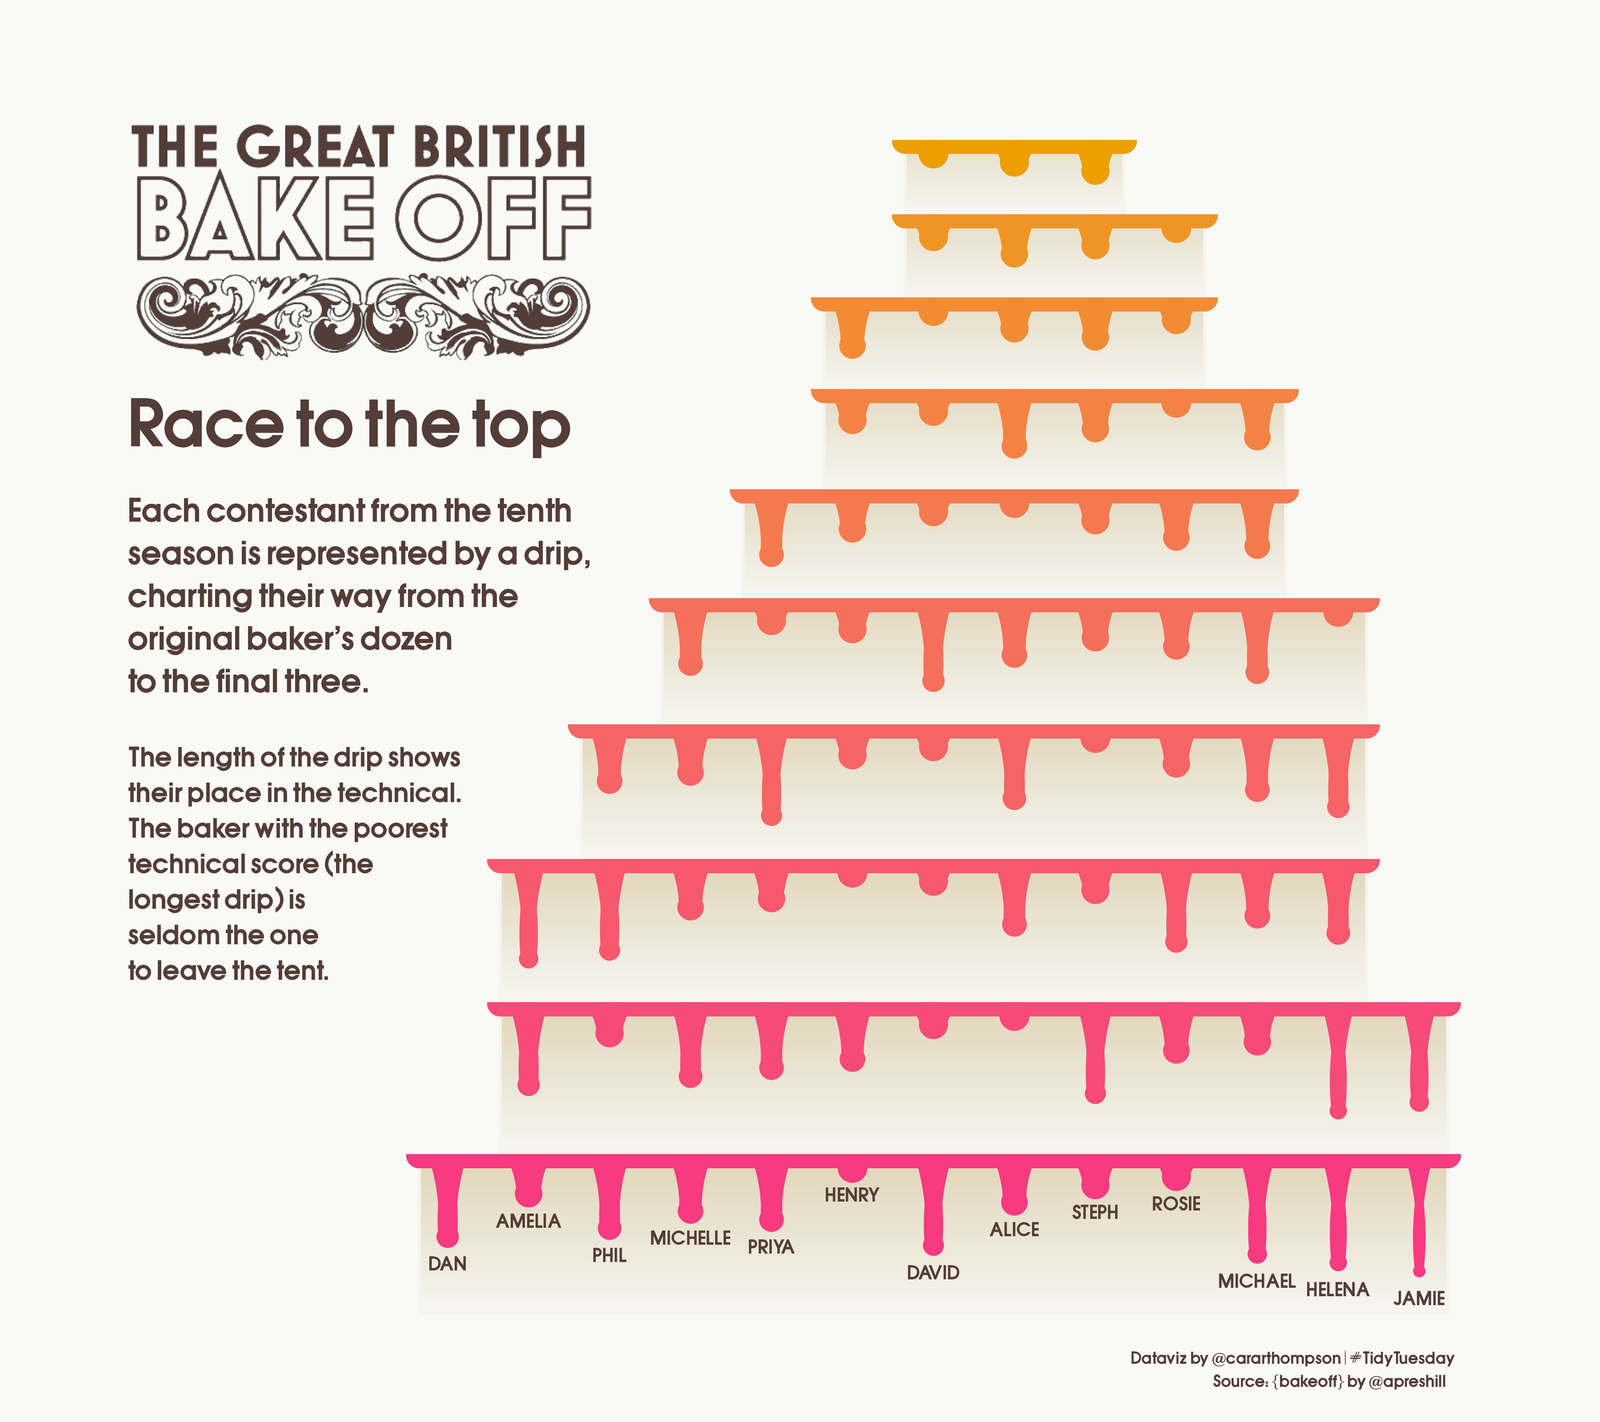
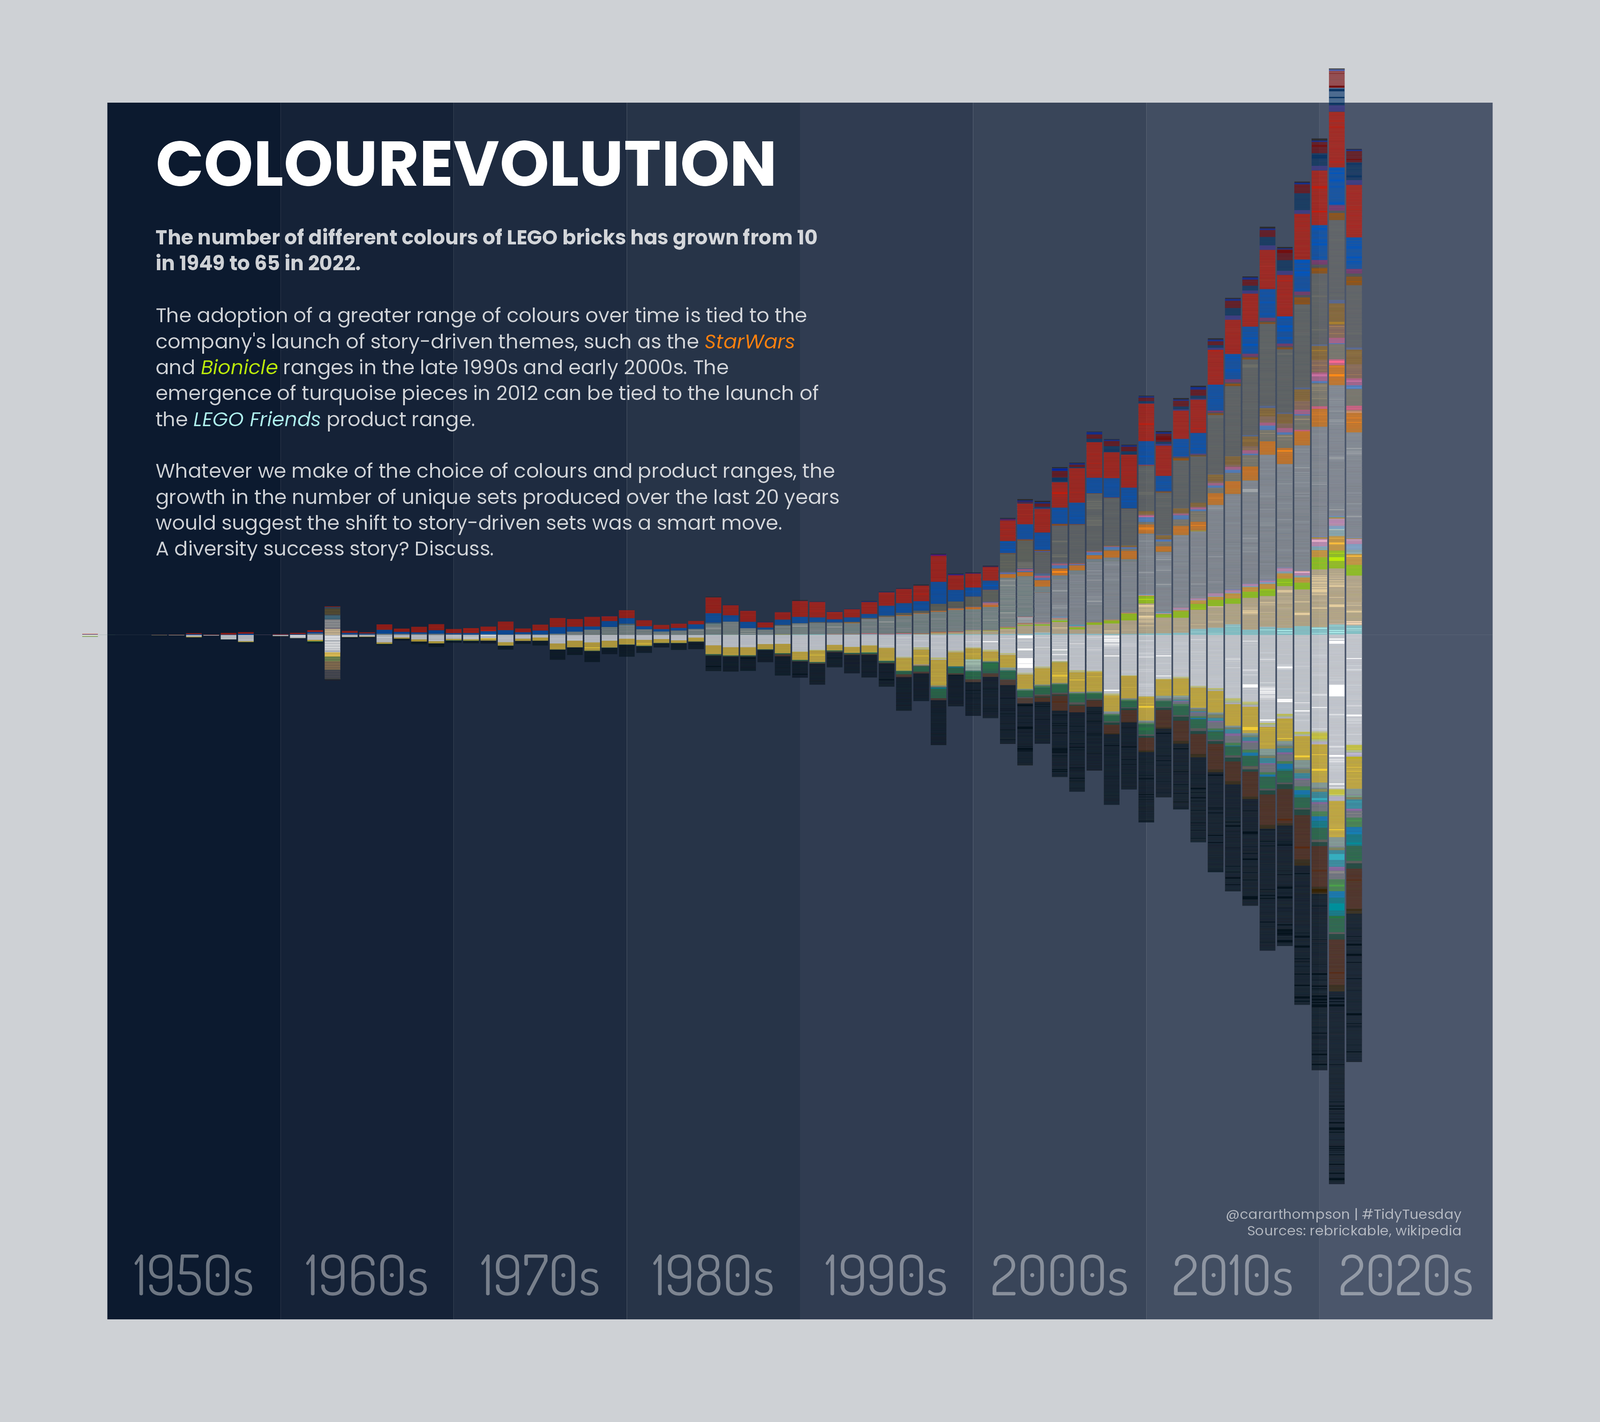
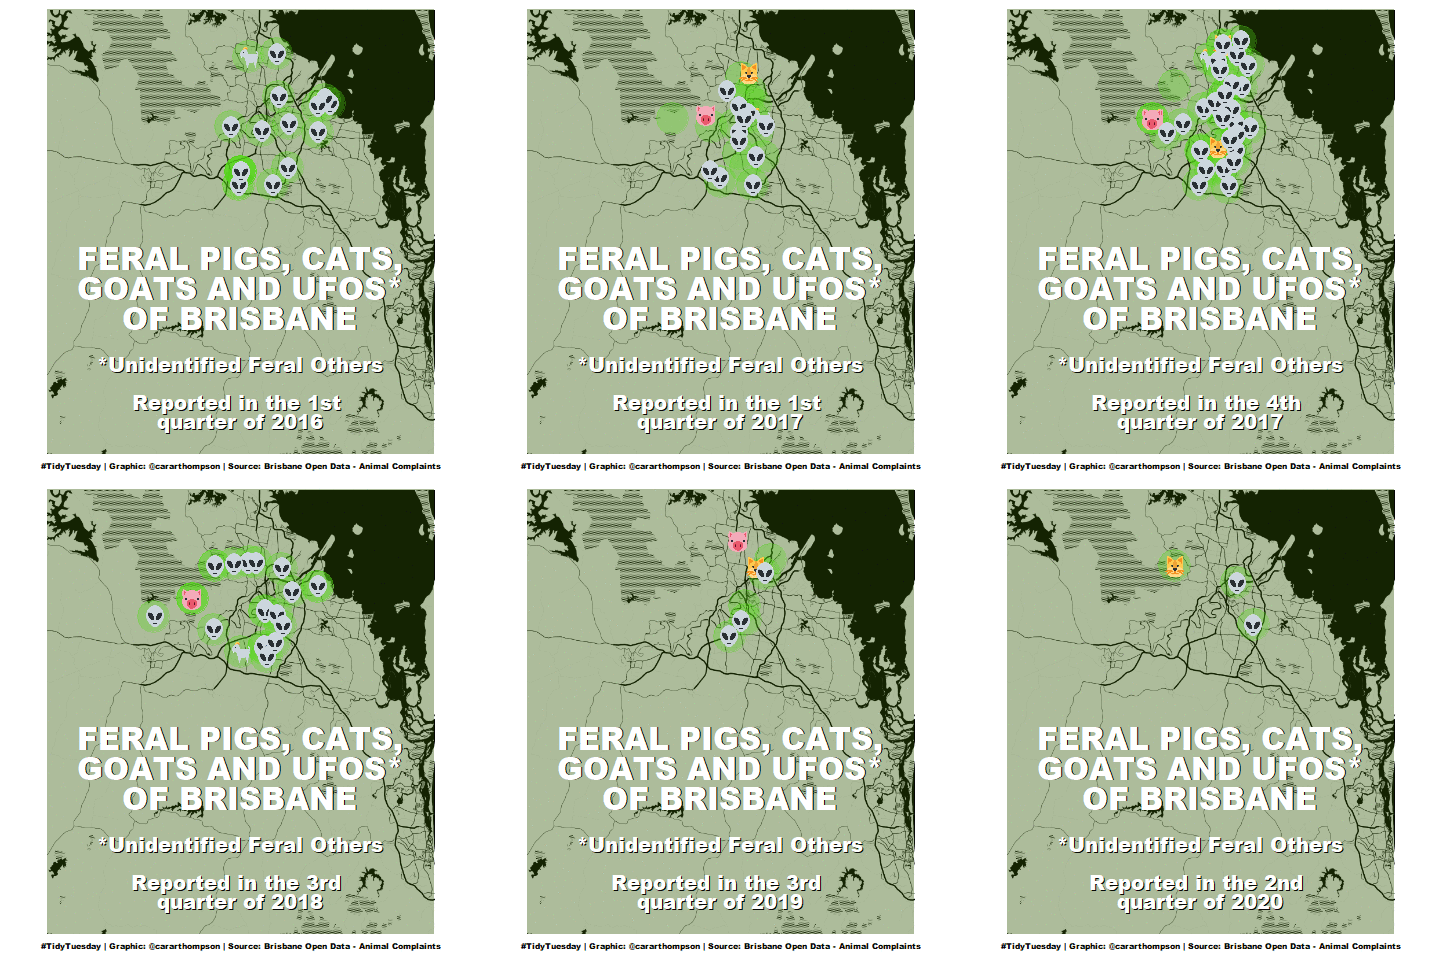
And if you find yourself making the same plot(s) time and time again, let’s work together on a data-to-viz solution, so that you only have to use one line of code next time. Your time is better spent on other things! We can package up a plot function to avoid all that copy-pasting, and give it as much flexibility as you need to get good use out of it.
Training, Consultation and Mentoring
I really liked Cara’s way of teaching. She was incredibly engaging and made everything interactive. I always felt that if I did need to ask a question, she would be happy to answer.
Marina Lewis • Principal Manager at Planning and Performance at Natural England
The talks section on my website offers a few resources that you can make use of either for yourself or as an organisation. If you’re looking for something more bespoke, I enjoy meeting clients where their dataviz needs are, and look forward to hearing what you have in mind.
Tell me more about your context, where you feel you could do with a few pointers, and we’ll make a plan from there.
Read what others had to say about recent workshops and training days here.