From basic to Wow every time in no time with your own ggplot2 theme

data-visualisation
r-how-to
dataviz-design-system

Talk given for the International Day of Women in Statistics and Data Science, as part of a panel on the topic of Coding is for everyone. We restyled a graph, and captured as much of the restyling as we could within a custom ggplot2 theme so that we could apply it to other graphs. Feel free to reuse the custom theme!

Written by
Affiliation

Building Stories with Data

Published

October 6, 2026

Recording

Coming soon!

Slides

View full screen

New tricks

  • {munch}
  • theme(geom = element_geom(family = "My font", fontsize = unit(12, "pt"))) (or replace with a text size that is calculated from your theme’s base text size… see below!)
  • scales::breaks_width(1)
  • scale_y_continuous(limits = c(0, NA))

Final code

The data

Code
all_the_bakes <- bakeoff::challenges |>
  dplyr::select(-technical) |>
  tidyr::pivot_longer(c(signature, showstopper)) |>
  dplyr::group_by(series) |>
  dplyr::mutate(
    chocolate_count = sum(grepl("[Cc]hocolat", value)),
    raspberry_count = sum(grepl("[Rr]aspberr", value)),
    orange_count = sum(grepl("[Oo]range", value))
  ) |>
  dplyr::select(series, chocolate_count, raspberry_count, orange_count) |>
  unique() |>
  tidyr::pivot_longer(-series) |>
  dplyr::mutate(
    rank = rank(-value, ties.method = "min"),
    mary_berry = dplyr::case_when(series < 8 ~ "yes", TRUE ~ "no")
  ) |>
  tidyr::pivot_wider(names_from = name, values_from = c(rank, value)) |>
  dplyr::rename(
    chocolate = value_chocolate_count,
    raspberry = value_raspberry_count,
    orange = value_orange_count
  ) |>
  dplyr::select(series, mary_berry, chocolate, raspberry, orange) |>
  tidyr::pivot_longer(-c(series, mary_berry), names_to = "ingredient")

The styling

Code
bakeoff_palette <- c(
  "chocolate" = "#561c2f",
  "orange" = "#e9a403",
  "raspberry" = "#d33b66",
  "mary" = "#f0c9df",
  "default" = "#187194",
  "dark_text" = "#04161D",
  "light_text" = "#36444A",
  "background" = "#f7f5f1"
)

theme_wow <- function(base_text_size = 12, my_palette = bakeoff_palette) {
  theme_minimal(base_size = base_text_size) +
    theme(
      text = element_text(
        family = "Cabin",
        colour = my_palette["light_text"]
      ),
      geom = element_geom(
        fill = my_palette["default"],
        pointsize = 5,
        pointshape = 21,
        borderwidth = 0.5,
        colour = my_palette["light_text"],
        fontsize = unit(base_text_size * 0.8, "pt")
      ),
      legend.position = "top",
      legend.justification = 0,
      legend.location = "plot",
      legend.title = element_blank(),
      plot.title.position = "plot",
      plot.title = munch::element_md(
        size = rel(1.5),
        family = "Cabin bold",
        colour = my_palette["dark_text"],
        lineheight = 1.3
      ),
      plot.subtitle = munch::element_md(lineheight = 1.3),
      plot.background = element_rect(fill = my_palette["background"]),
      panel.grid = element_line(colour = "#ffffff"),
      panel.grid.major.x = element_blank(),
      panel.grid.minor.x = element_blank(),
      plot.margin = margin_auto(base_text_size * 1.5)
    )
}

The basic plot

Code
library(ggplot2)

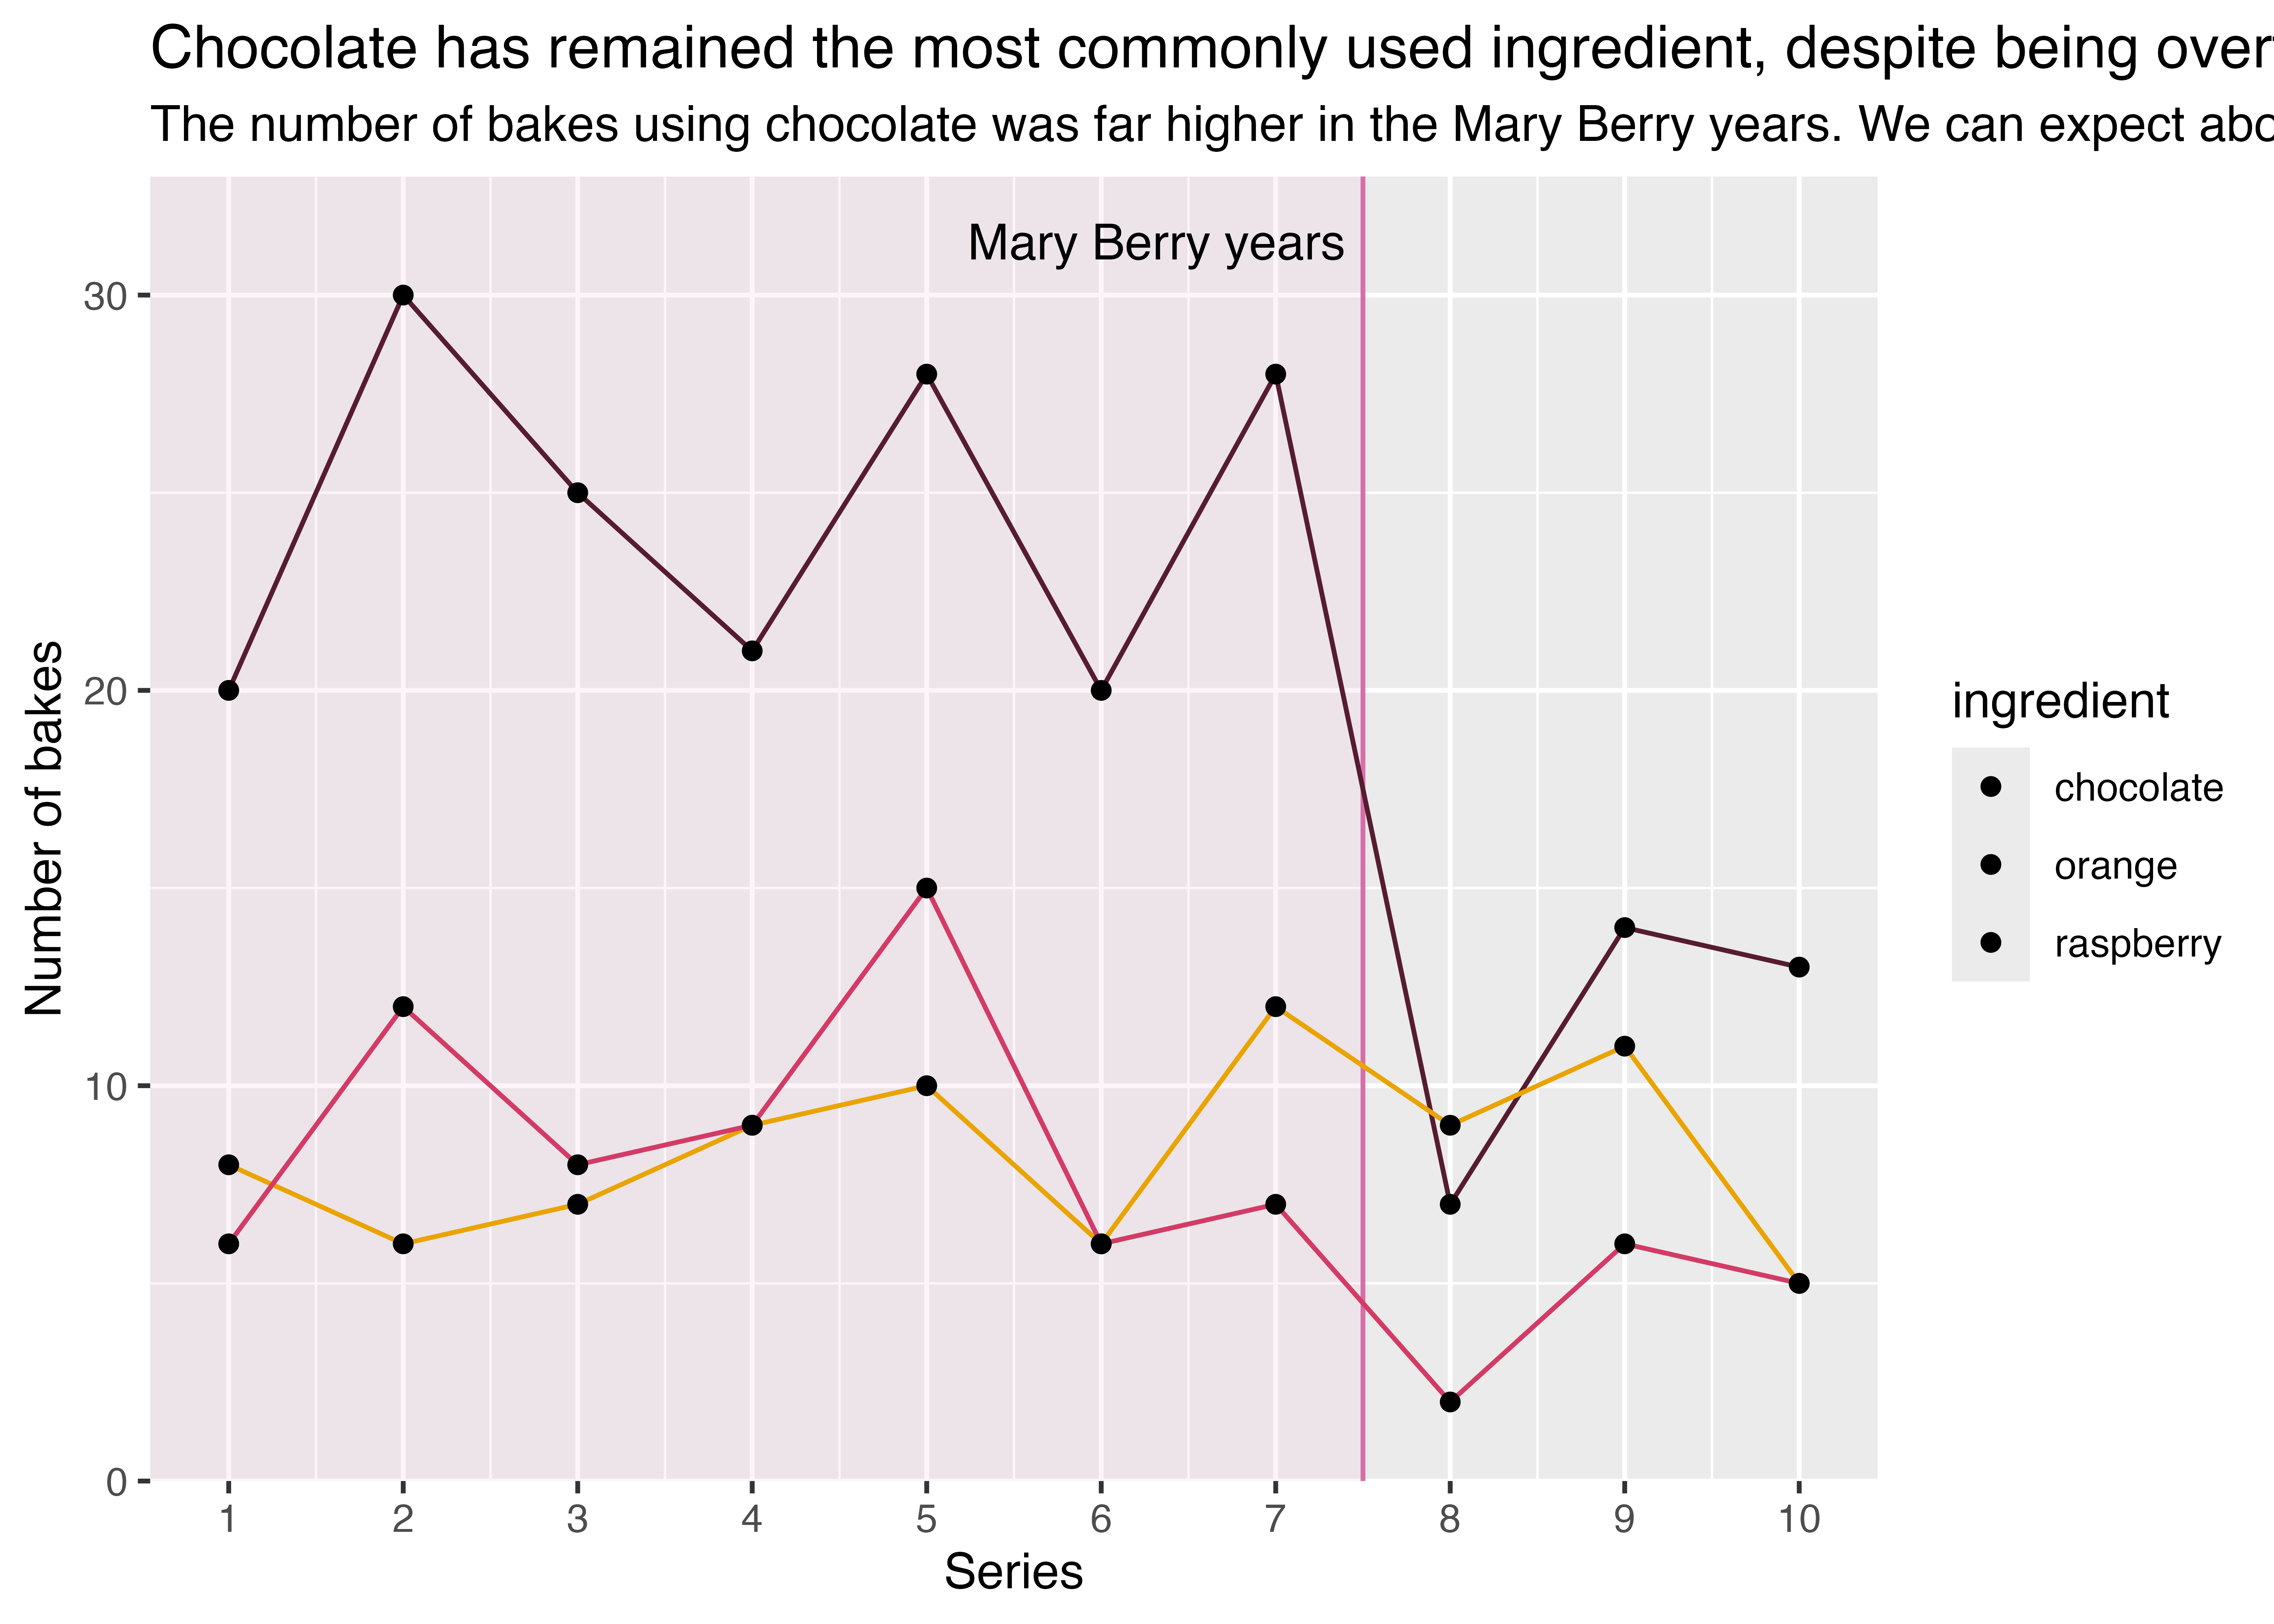
basic_plot <-
  all_the_bakes |>
  ggplot(aes(
    x = series,
    y = value,
    fill = ingredient
  )) +
  annotate(
    geom = "rect",
    xmin = -Inf,
    xmax = 7.5,
    ymin = -Inf,
    ymax = Inf,
    fill = bakeoff_palette["mary"],
    colour = "transparent",
    alpha = 0.2
  ) +
  geom_vline(
    xintercept = 7.5,
    linetype = 1,
    linewidth = 0.5,
    colour = "#d76ea9"
  ) +
  annotate(
    "text",
    x = 7.4,
    y = I(0.95),
    label = "Mary Berry years",
    hjust = 1
  ) +
  geom_line(
    aes(
      colour = ingredient
    ),
    show.legend = FALSE
  ) +
  geom_point() +
  labs(
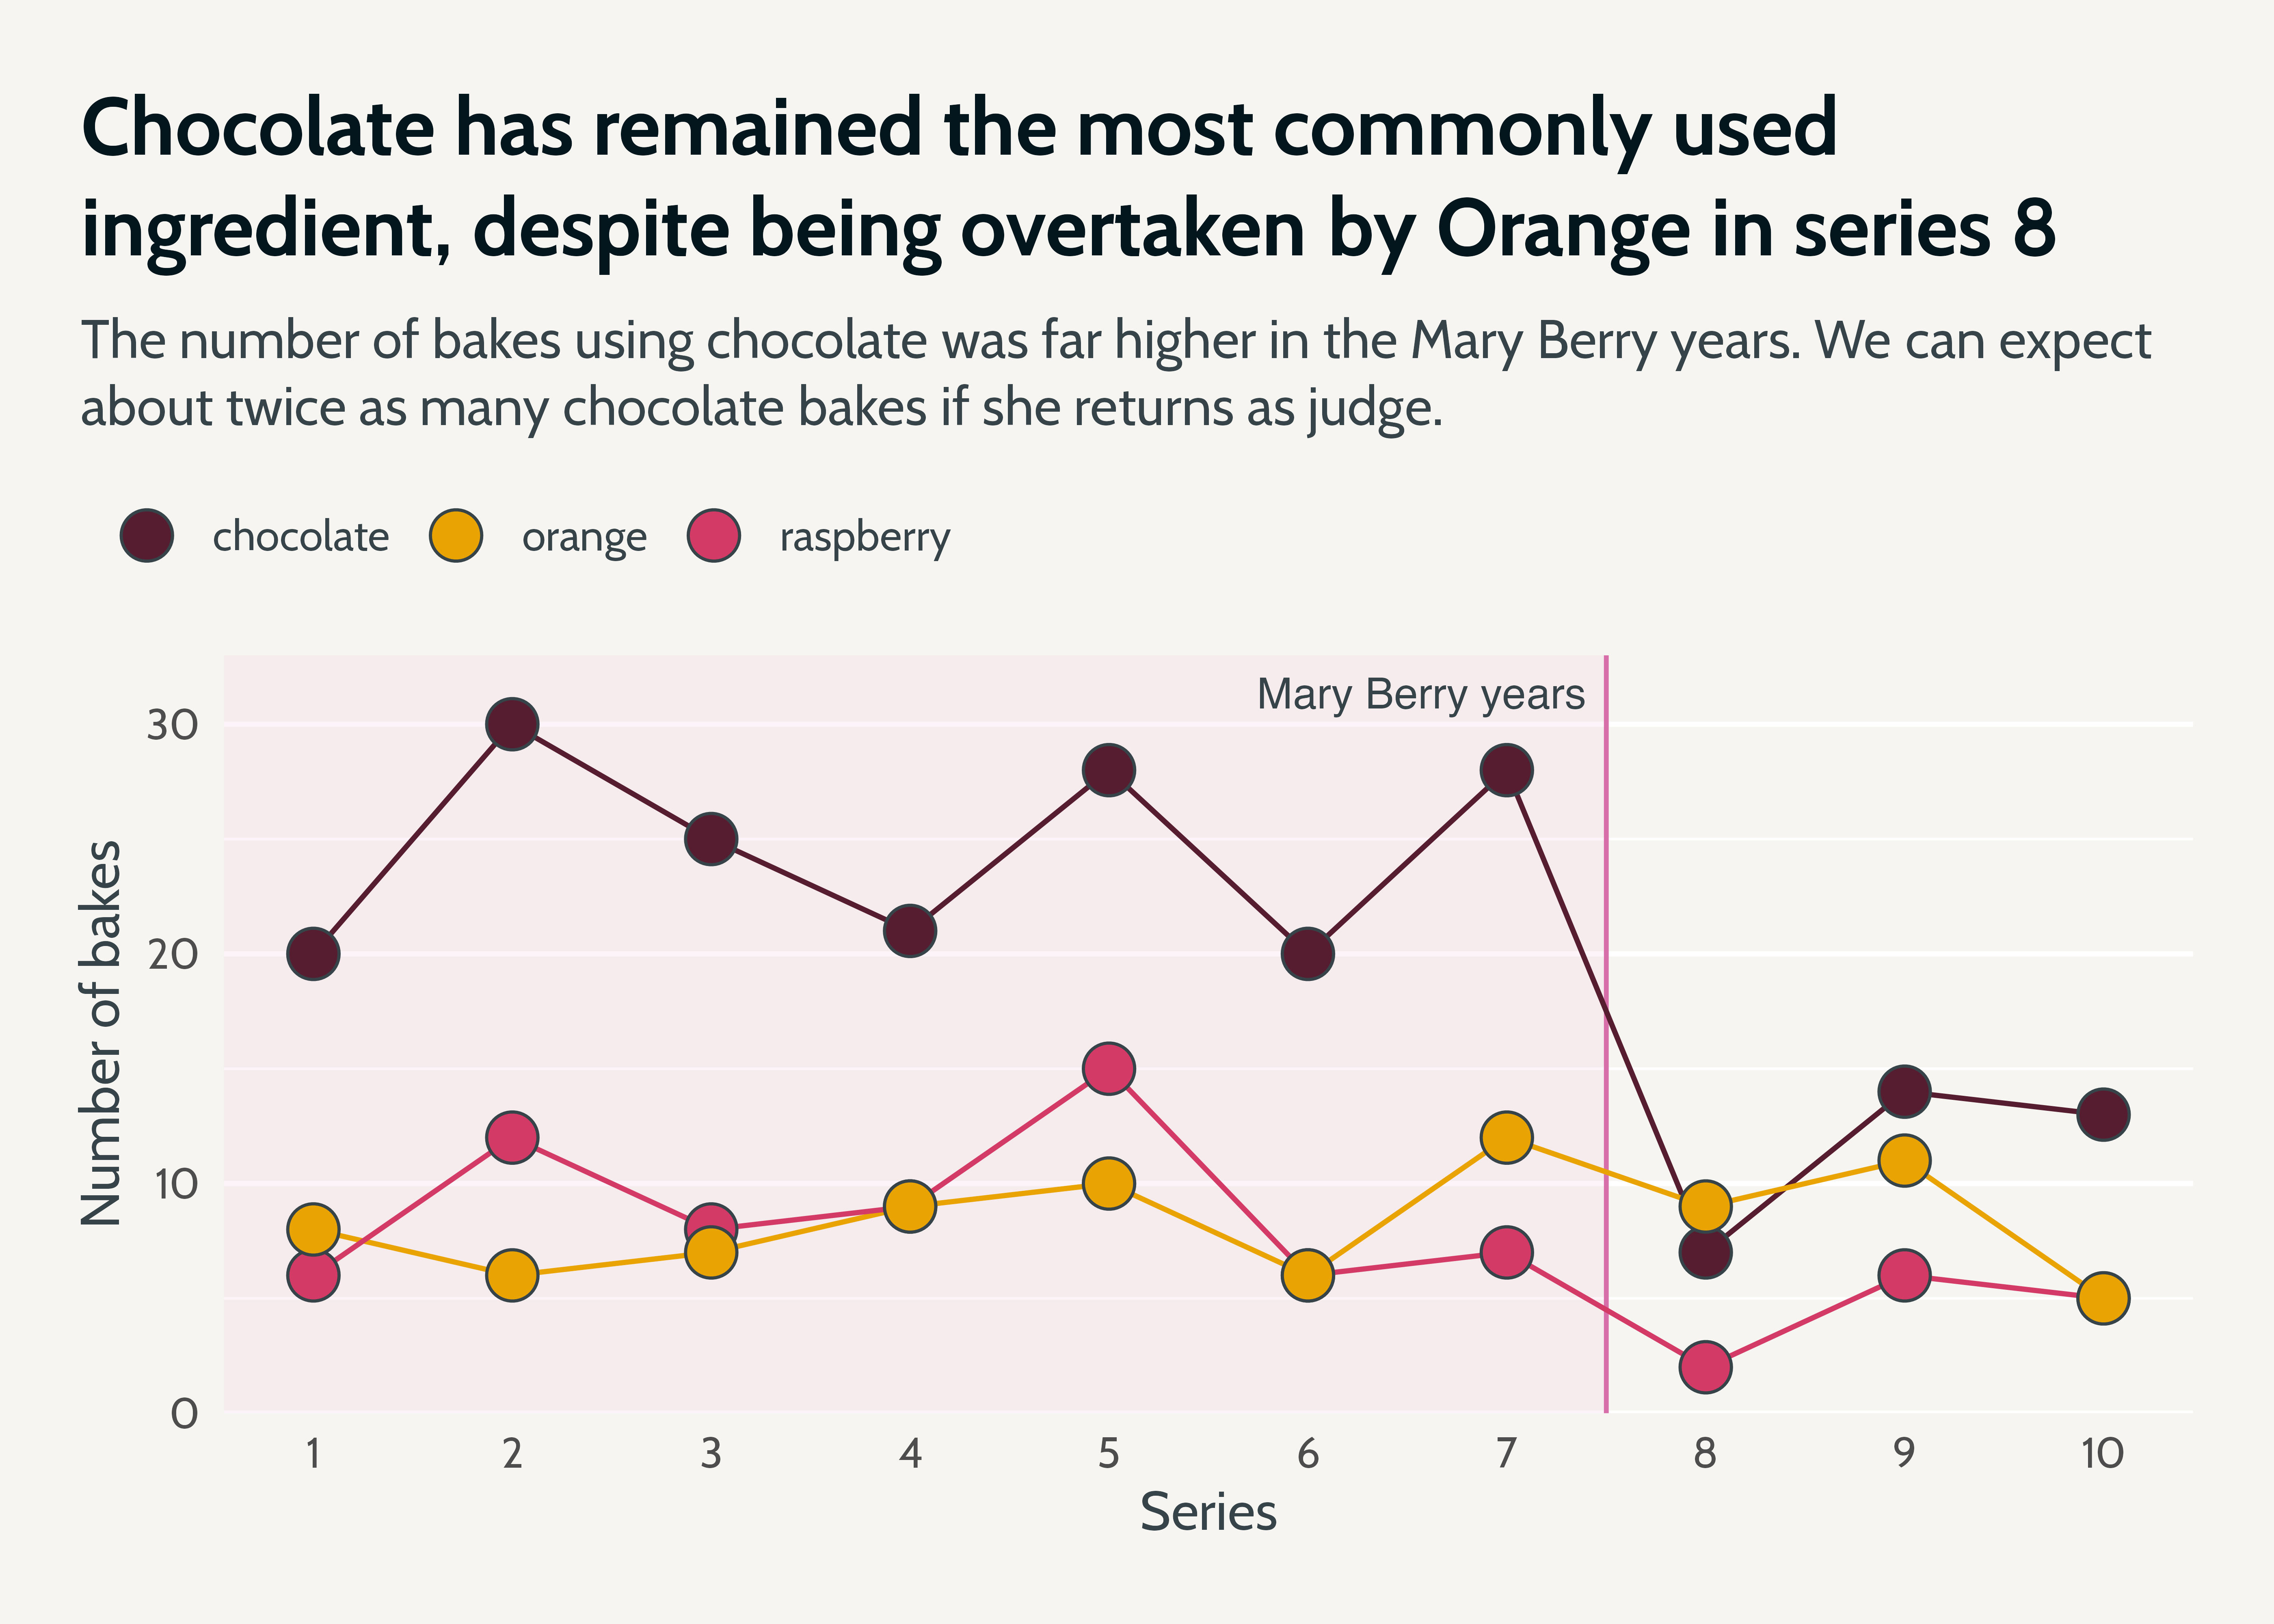
    title = "Chocolate has remained the most commonly used ingredient, despite being overtaken by Orange in series 8",
    subtitle = "The number of bakes using chocolate was far higher in the Mary Berry years. We can expect about twice as many chocolate bakes if she returns as judge.",
    x = "Series",
    y = "Number of bakes"
  ) +
  scale_colour_manual(
    aesthetics = c("colour", "fill"),
    values = bakeoff_palette
  ) +
  scale_x_continuous(breaks = scales::breaks_width(1)) +
  scale_y_continuous(
    limits = c(0, NA),
    expand = expansion(add = c(0, 3))
  )
basic_plot

Pulling it all together

basic_plot +
  theme_wow()

Reuse

Citation

For attribution, please cite this work as:
Thompson, Cara. 2026. “From Basic to Wow Every Time in No Time with Your Own Ggplot2 Theme.” October 6, 2026. https://www.cararthompson.com/talks/basic-to-wow-ggplot2/.