library(visNetwork)
library(tidyverse)
library(extrafont)
library(viridis)

vis.links <- read.csv(
  "data/202008_polanus_edges.csv",
  header = T,
  stringsAsFactors = F
)

vis.nodes <- read.csv(
  "data/202008_polanus_nodes.csv",
  header = T,
  stringsAsFactors = F
) %>%
  mutate(
    overarching = factor(overarching),
    shape = "dot",
    shadow = T,
    label = characteristic,
    size = level * 4,
    borderwigth = 2,
    font.size = level + 25,
    color.border = "black",
    color.highlight.border = "slategrey"
  )

vis.nodes$color.background <- vis.nodes$color.highlight.background <-
  c(viridis(5)[5:1])[vis.nodes$overarching]

blessedness <-
  visNetwork(
    vis.nodes,
    vis.links,
    main = list(
      text = "Doctrine Of God Contained Within Divine Blessedness <br> According To Polanus",
      style = "font-family:Raleway;color:#666561;font-size:20px;text-align:center;"
    ),
    footer = list(
      text = "Graohic: @crthompson | Source: Polanus' Partitiones Theologicae, 1590",
      style = "font-family:Raleway;color:#666561;font-size:10px;text-align:center;"
    )
  ) %>%
  visOptions(highlightNearest = list(enabled = T, degree = 1, hover = F)) %>%
  visInteraction(dragNodes = T, dragView = F, zoomView = F)

print(htmltools::tagList(blessedness))

visSave(
  graph = blessedness,
  file = "../plots/202008_polanus.html",
  selfcontained = TRUE
)Turning a 16th century theological data visualisation into an interactive network graph
data-visualisation
annotations
r-how-to
ggplot2
This hierarchical graph looked too structured to the people talking about it. So I reworked it into something a bit more organic…
I took a different approach to developing #rstats and #dataviz skills this week, in response to a tweet by Fred Sanders about a series of data visualisations in 16th century theological writing.
Dataviz redo
Here’s the original dataviz.
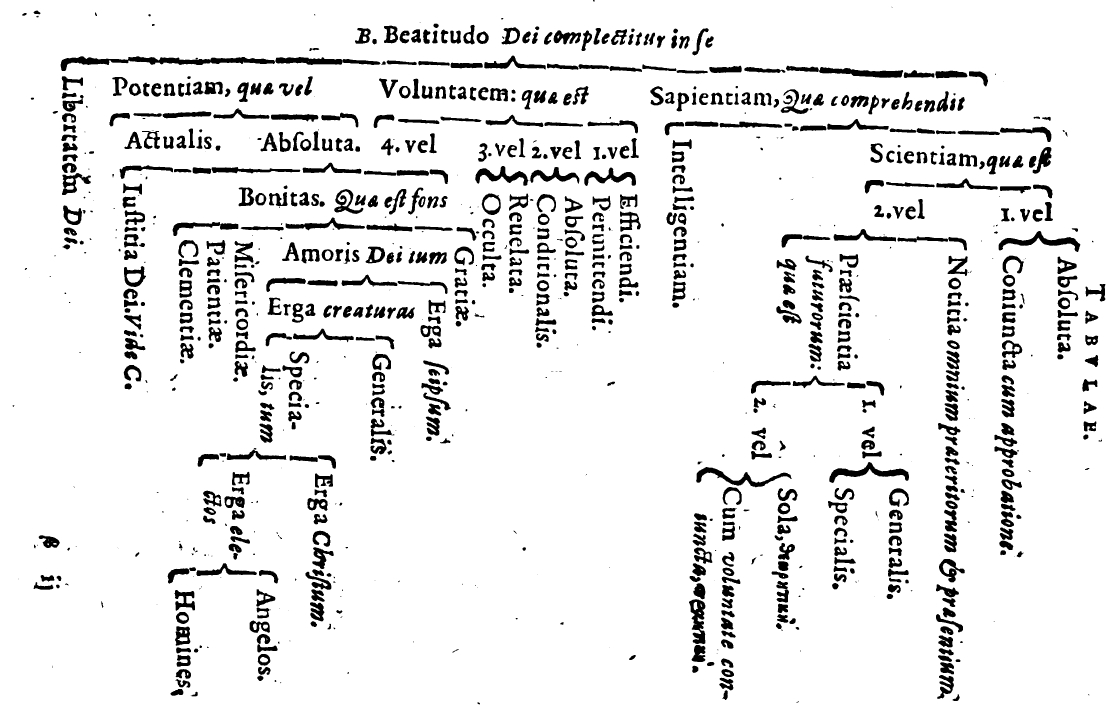
I had recently come across those network graphs that wiggle when you click and drag nodes in them, and one of comments on the original tweet was that the original dataviz looked too structured. So here’s what I did: a more organic-looking way of presenting the same data. Click and drag a few points around to see what I mean!
How did I do it?
This was a very quick proof of concept, to see if I could learn to use {visNetwork} rather than {ggplot} and make it do something sensible with this dataset. Getting the data organised into nodes and edges was the biggest bit of the work. The code for creating the interactive visualisation was actually not too tricky!
The intriguing thing looking back at this at the time of republishing is that the plot aesthetics are largely carried by the data, which isn’t how I usually approach things. Every day a school day. Or as the French say, I shall go to bed less stupid!
Reuse
Citation
For attribution, please cite this work as:
Thompson, Cara. 2020. “Turning a 16th Century Theological Data
Visualisation into an Interactive Network Graph.” August 18,
2020. https://www.cararthompson.com/posts/2020-08-18-making16th-century-theological-dataviz-interactive/.