Introducing my new #rstats 📦: {monochromeR}
An easy way to create, view and use monochrome colour palettes.
- Here’s the GH repo: github.com/cararthompson/monochromeR
- To give it a whirl:
install.packages("monochromeR")
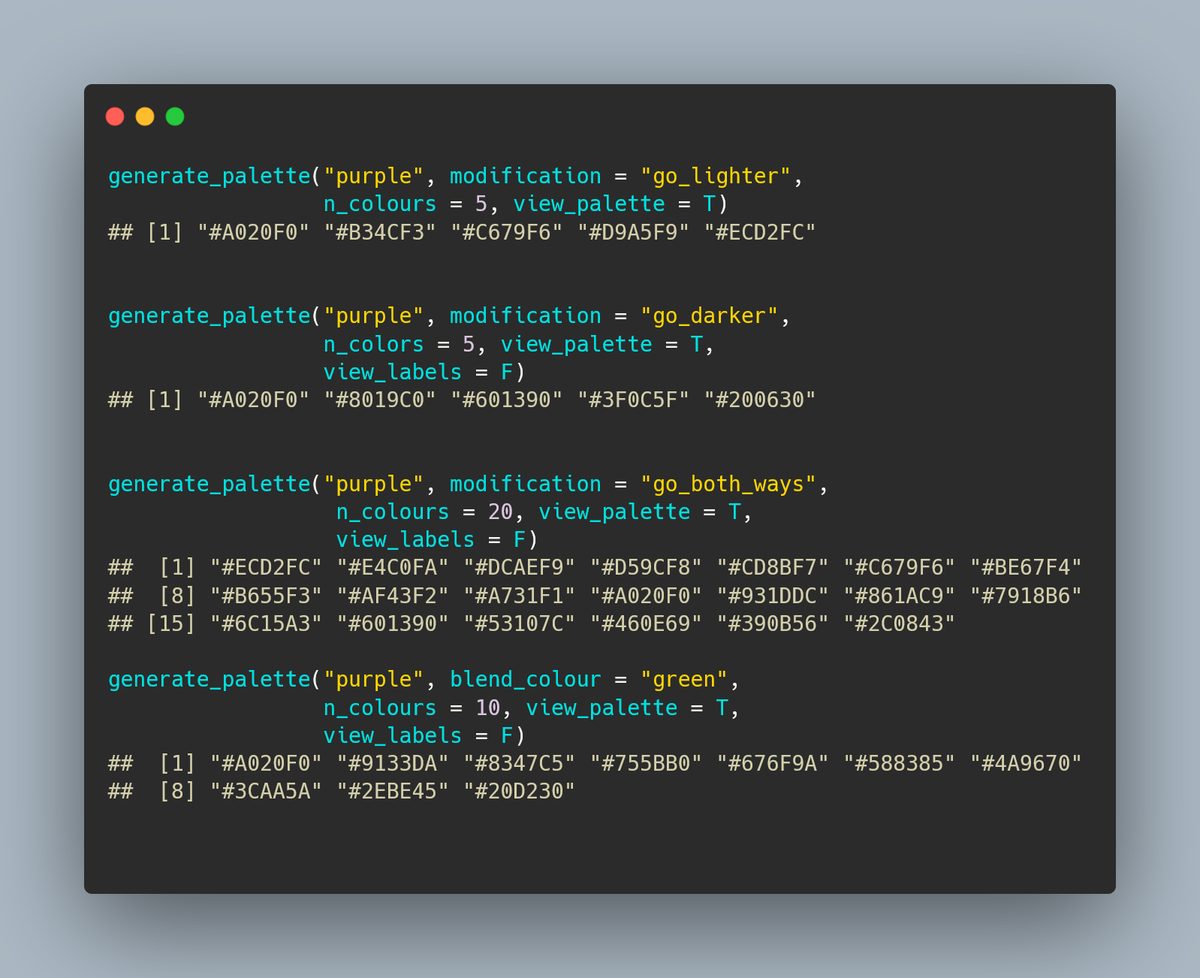
Here’s a quick demo!
The main function returns a vector of hex codes. It can display the palette in the plot viewer, with or without labels. The input colour/color can be hex, rgb or a recognised colour name (used here for readability).
Just for fun, it can also blend two colours together.
One of its use cases is crafting polished #dataviz with a unified aesthetic with minimal effort.
I think it was ijeamaka_a who first put the idea of using monochrome palettes in my head (thanks!). If you haven’t seen her work, please go and check it out!
Here’s {monochromeR applied to the code behind my aRtfulBot with some suitably festive colours. Looking forward to exploring it further in my next #rtistry project!”
Reuse
Citation
For attribution, please cite this work as:
Thompson, Cara. 2021. “Introducing My New #Rstats 📦:
{monochromeR}.” December 16, 2021. https://www.cararthompson.com/posts/2021-12-16-introducing-a-new-rstats-u-0001f4e6/.

