# custom function
limits_fun <- function(x) {
  if (between(ymd(min(x)), ymd("1930-01-01"), ymd("1949-12-31"))) {
    c(ymd("1930-01-01"), ymd("1949-12-31"))
  } else if (between(ymd(min(x)), ymd("1950-01-01"), ymd("1969-12-31"))) {
    c(ymd("1950-01-01"), ymd("1969-12-31"))
  }
  # etc...
}

# plot code
plot +
  facet_wrap(~decades, ncol = 1, scales = "free_x") +
scale_x_date(limits = limits_fun)Visualising the NYT Bestsellers in this week’s #TidyTuesday
- 🔧#rstats
- 💡Creating shelves with fixed ranges (see 👇)
- 💻(incl. the answers) github.com/cararthompson/tidytuesdays
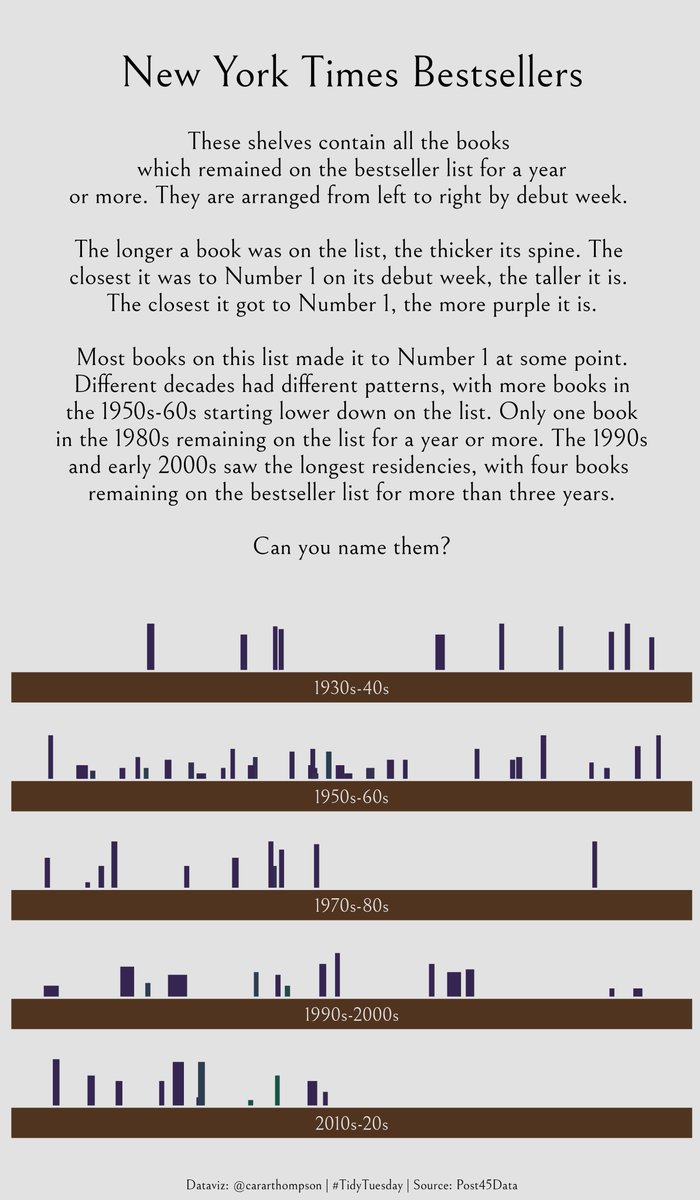
 {fig-alt=“A dataviz in the form of shelves with bars representing books. Each shelf spans two decades from 1930 to present. The text above the plot, formatted to resemble the opening pages of a novel reads: These shelves contain all the books which remained on the bestseller list for a year or more. They are arranged from left to right by debut week.
The longer a book was on the list, the thicker its spine. The closest it was to Number 1 on its debut week, the taller it is. The closest it got to Number 1, the more purple it is.
Most books on this list made it to Number 1 at some point. Different decades had different patterns, with more books in the 1950s-60s starting lower down on the list. Only one book in the 1980s remaining on the list for a year or more. The 1990s and early 2000s saw the longest residencies, with four books remaining on the bestseller list for more than three years.
Can you name them?” fig-align=“center”}
“These shelves cont
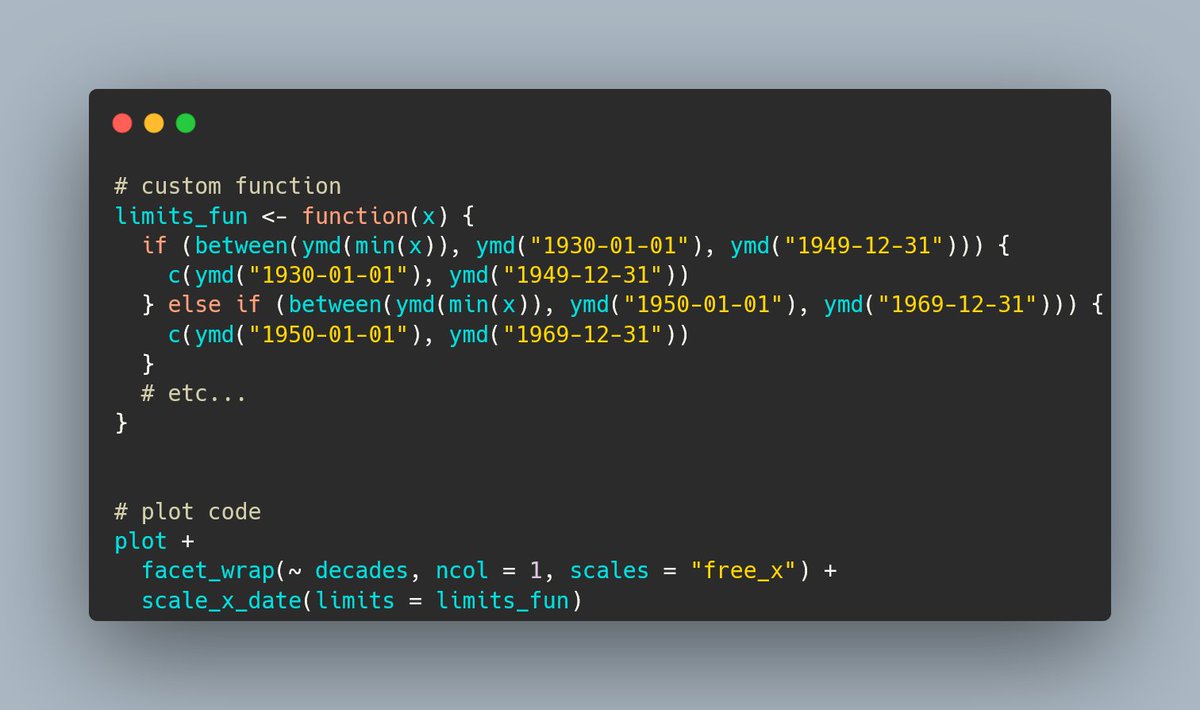
To get each shelf (facet) to span two decades, scales = "free_x" didn’t work because the data in the different decades had different ranges.
Instead, I created a custom function to feed into scales_x_date(), building on this solution by coolbutuseless: coolbutuseless.github.io/2019/03/07/custom-axis-breaks-on…
And here’s the making of!
