library(ggplot2)
::penguins |>
palmerpenguinsggplot(aes(x = bill_length_mm, y = flipper_length_mm, colour = species)) +
geom_point() +
labs(
title = "Perfectly Proportional Penguins",
subtitle = "Ah, that's better!",
caption = "Data from {palmerpenguins}"
+
) theme_void() +
theme(
plot.background = element_rect(colour = "black", linewidth = 1)
)
What are the default margins in ggplot’s theme_minimal() and theme_void()?
Turns out they are different, but you can easily tweak your code to get the same margins across all your graphs!
Today’s #rstats #ggplot discovery: the default margins.
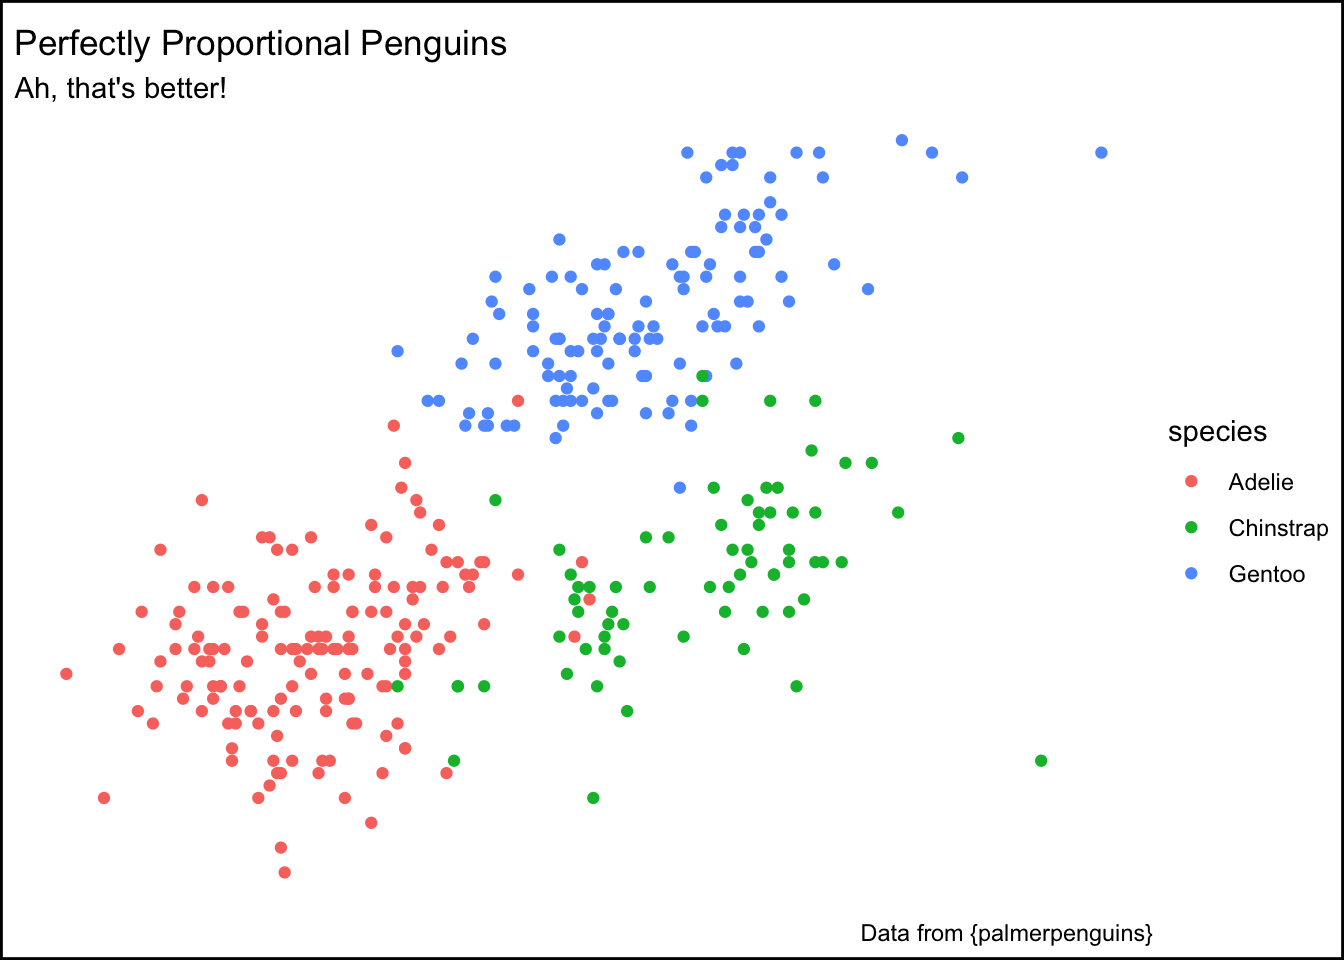
- 🖼️
theme_minimal()
uses margins 5.5 points all round - 
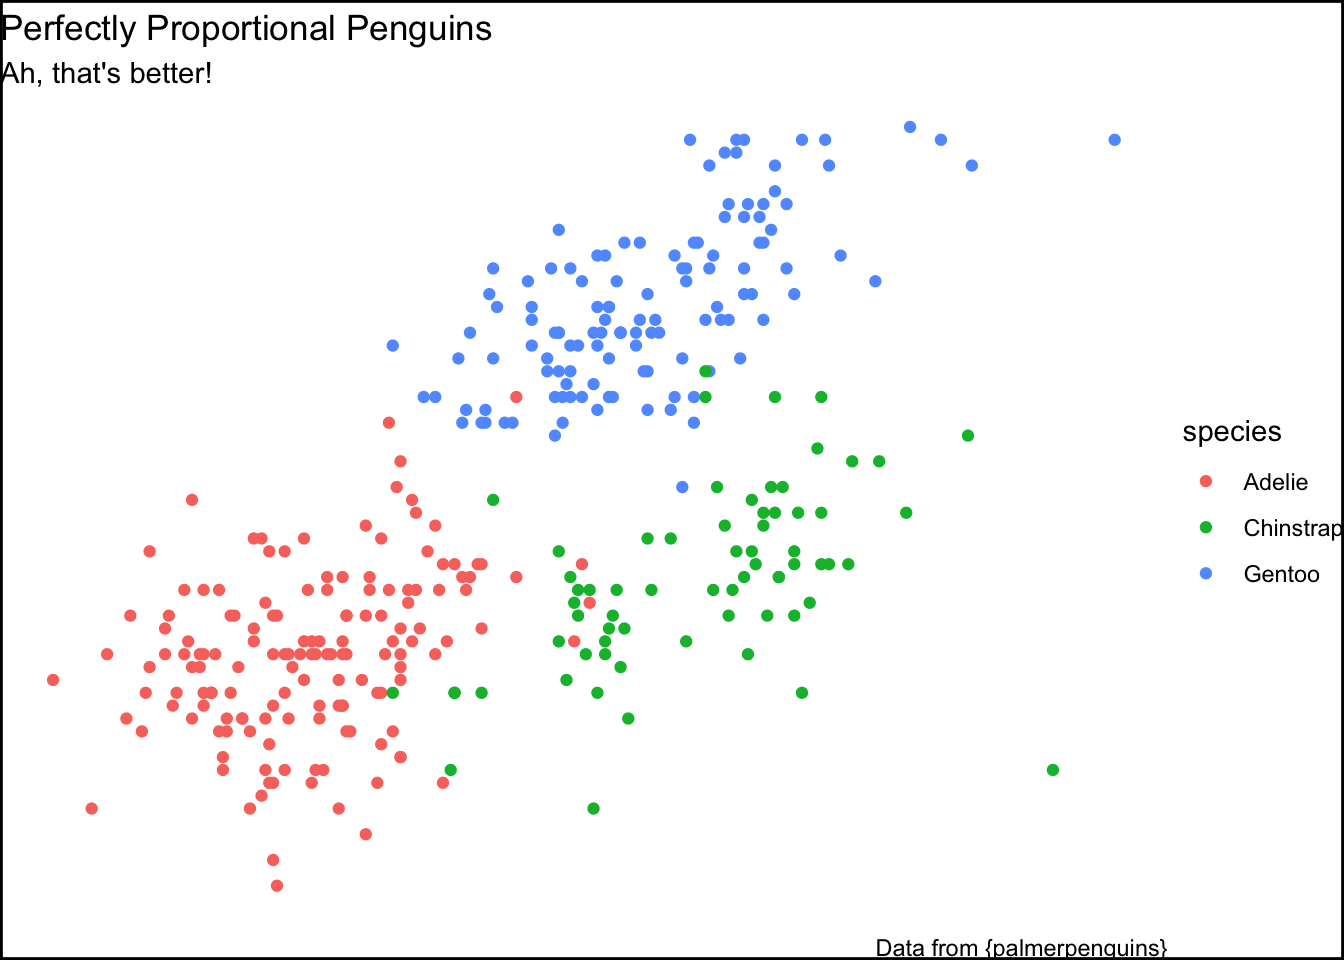
❌
theme_void()
uses 0 lines
If you want them to match, use theme_void()
, and have the same margins as with theme_minimal()
, all you need to do is add + theme(plot.margins = margin(5.5, 5.5, 5.5, 5.5))
to your plot code - the default unit is “pt”
Quick demo
Without tweaking the margins in theme_void()
, the text goes right up to the edge of the graph.
But there’s a very simple fix to replicate the margins we get from theme_minimal()
:
::penguins |>
palmerpenguinsggplot(aes(x = bill_length_mm, y = flipper_length_mm, colour = species)) +
geom_point() +
labs(
title = "Perfectly Proportional Penguins",
subtitle = "Ah, that's better!",
caption = "Data from {palmerpenguins}"
+
) theme_void() +
theme(
plot.background = element_rect(colour = "black", linewidth = 1),
plot.margin = margin(5.5, 5.5, 5.5, 5.5) # <- this!
)
Tada!
P.S. I’m not recommending theme_void() for a scatterplot! This is just for illustration purposes!
Reuse
Citation
For attribution, please cite this work as:
Thompson, Cara. 2022. “What Are the Default Margins in Ggplot’s
Theme_minimal() and Theme_void()?” August 3, 2022. https://www.cararthompson.com/posts/2022-08-03-todays-rstats-ggplot-discovery-the/.