# Step 1: Register the "solid" variant of FA
systemfonts::register_variant(
"Font Awesome Solid",
family = "Font Awesome 6 Free",
weight = "heavy"
)
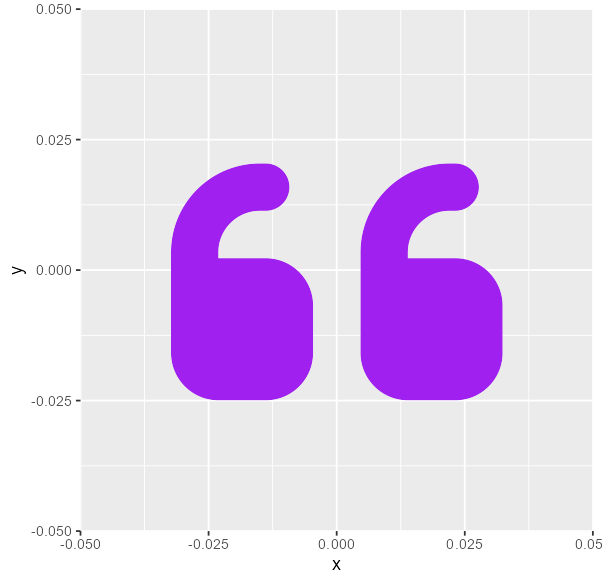
# Step 2: Use it within the plot
ggplot(NULL, aes(0, 0)) +
geom_text(
aes(label = "quote-left"),
colour = "purple",
size = 80,
family = "Font Awesome Solid"
)
# Step 3: Do mini victory danceTake a string and return a nicely formatted quote
r-how-to
data-visualisation
ggplot2
annotations
This morning I’ve been building an #rstats function to take a string and return a nicely formatted quote, using a client’s brand guidelines. It’s been a fun adventure involving fonts, hacking geom_textbox() and allowing for different string lengths.
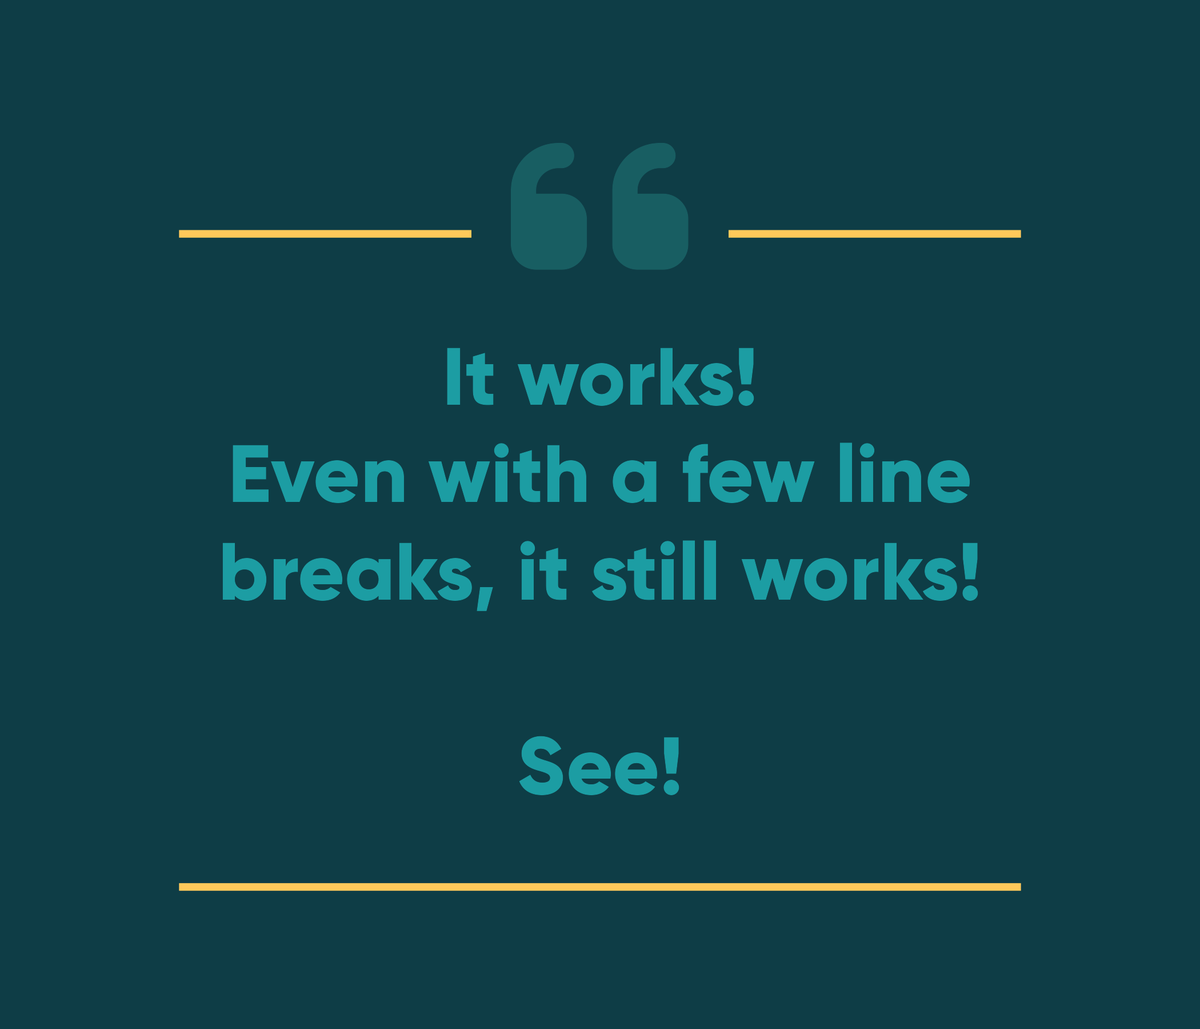
Here’s where I’ve landed.

To get there, the first step was to register the “solid” variant of Font Awesome, because that’s where the left-quote icon lives. This had been the missing piece of the puzzle in many previous failed attempts to get Font Awesome !
Then I needed to figure out how to get the textbox sides to disappear. Here’s the quote from the first image with all the box outlines showing. The key: feed it the same text, but make that text colour NA so that the box is the same height and adjust the padding and vjust/valign.
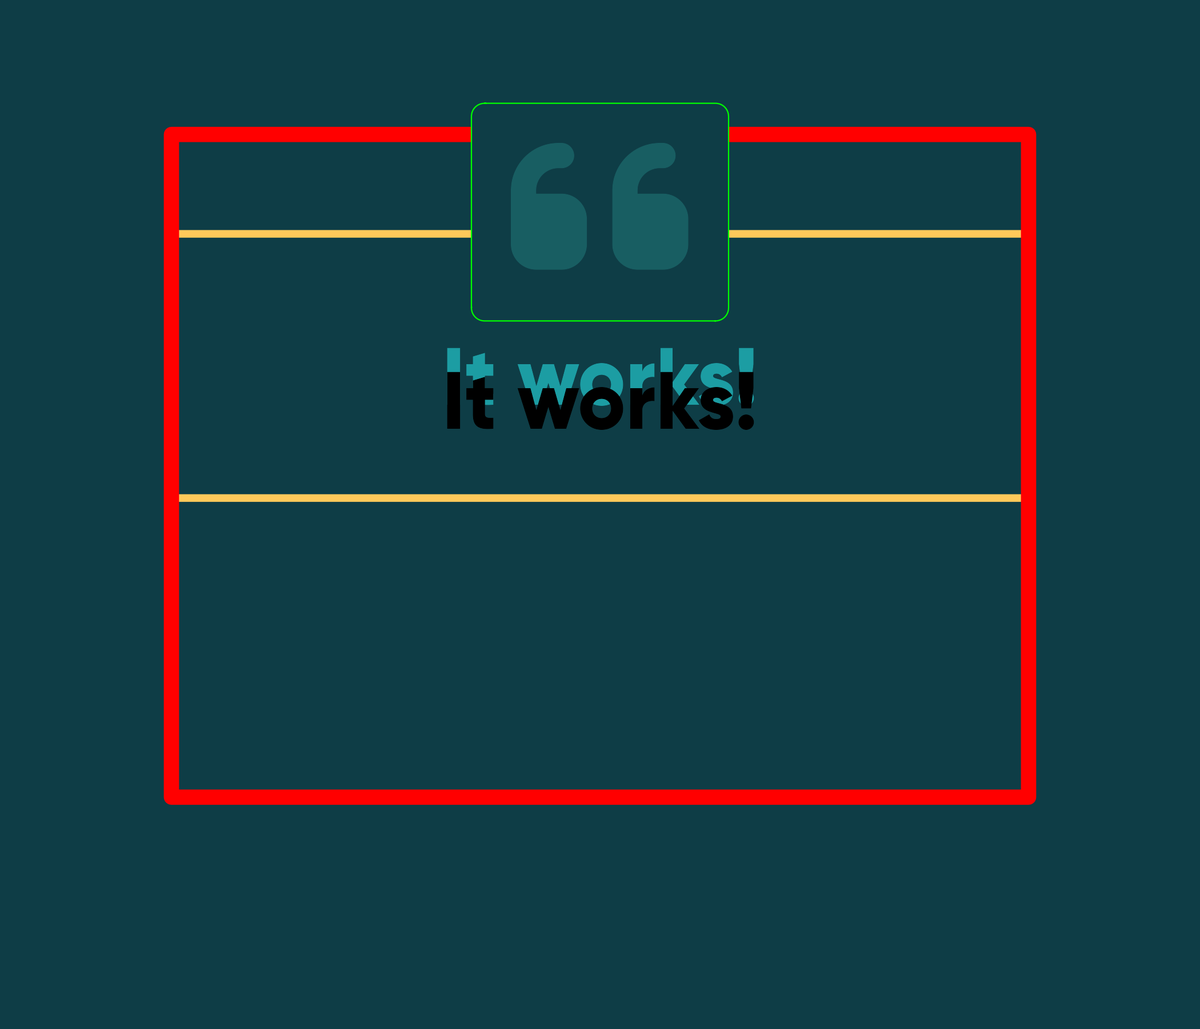
The beauty of using the outlines of the geom_textbox() rather than say adding a geom_hline() is that the line moves to fit the text.
Although I still needed to figure out a way of not letting the box get bigger than the exported plotting area…

The text size is set by a text_size variable within the function, which is dependent on the number of characters in the quote. So far it seems to be working… Next step, try it out with the client’s real quotes and see what breaks!
Reuse
Citation
For attribution, please cite this work as:
Thompson, Cara. 2022. “Take a String and Return a Nicely Formatted
Quote.” November 10, 2022. https://www.cararthompson.com/posts/2022-11-10-this-morning-ive-been-building/.