"

One solution to make text stand out against most backgrounds

Creating a #dataviz with smallish text, varying colours, programmatic text alignments, and you want the text to look crisp and easy to read regardless of its background? Using #rstats and #ggplot? ggfx::with_outer_glow() is your friend!
Author
Affiliation

Building Stories with Data

Published

January 6, 2023

Plot with ggfx::with_outer_glow() effect where the text outlines appear more crispOriginal plot where the text is a tad harder to read

First off, why?

Because things seem brighter in contrast to their opposite. Need white text to look whiter? Pop a black shadow around it.

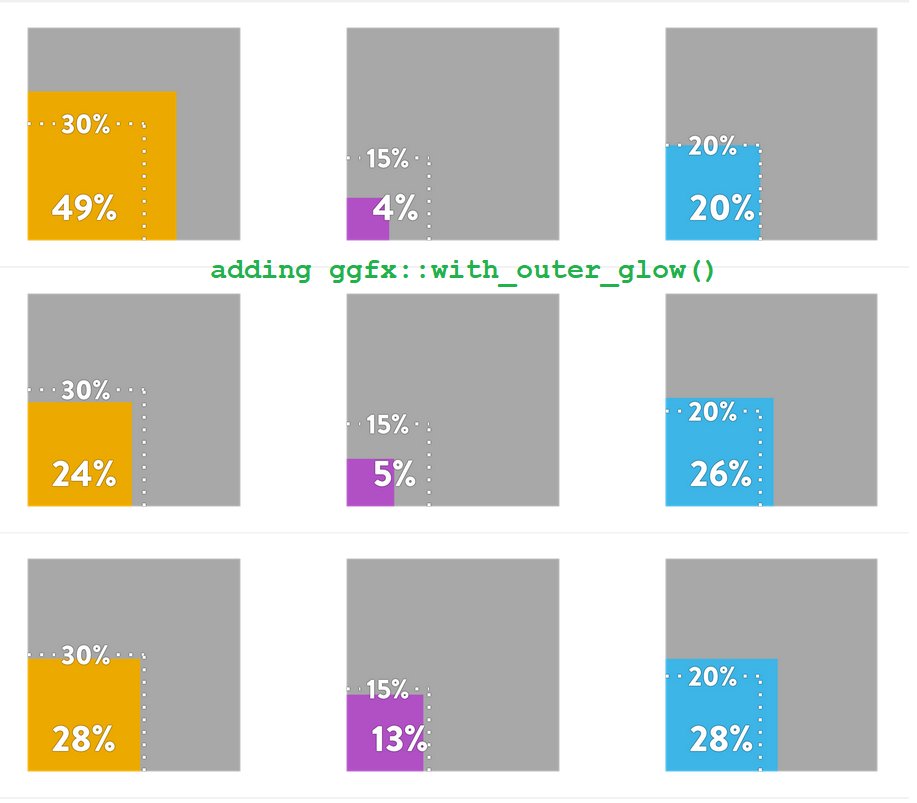
Didn’t see the shadow in the previous image? Perfect! I didn’t want the text to shout “look at this glow effect”, but just appear more crisp.

Optical illusion: grid of greyscale squares appearing brighter or darker dependent on their darker/brighter background

What about the code?

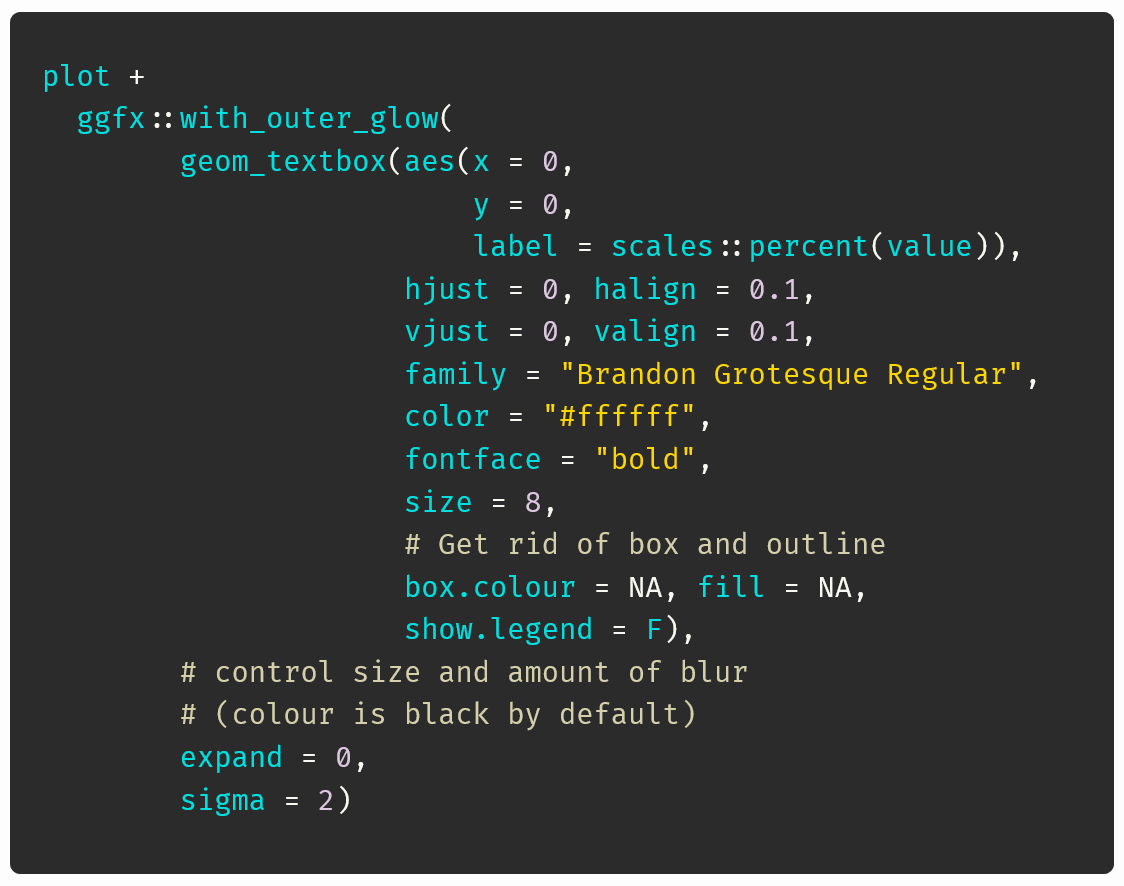
It’s super straightforward. Simply wrap your existing geom in ggfx::with_outer_glow() and the package does the complicated stuff for you!

You can vary the colour of the glow, the amount of blurring and the size of the glow, and it all plays nicely with text.

R script snippet applying an outer glow effect to text boxes in a plot. Specifies text position, font, size, and colour. Removes box outlines, controlling blur with expand and sigma parameters. Clear, well-commented code.

The arguments can be made to adapt to where the text is placed.

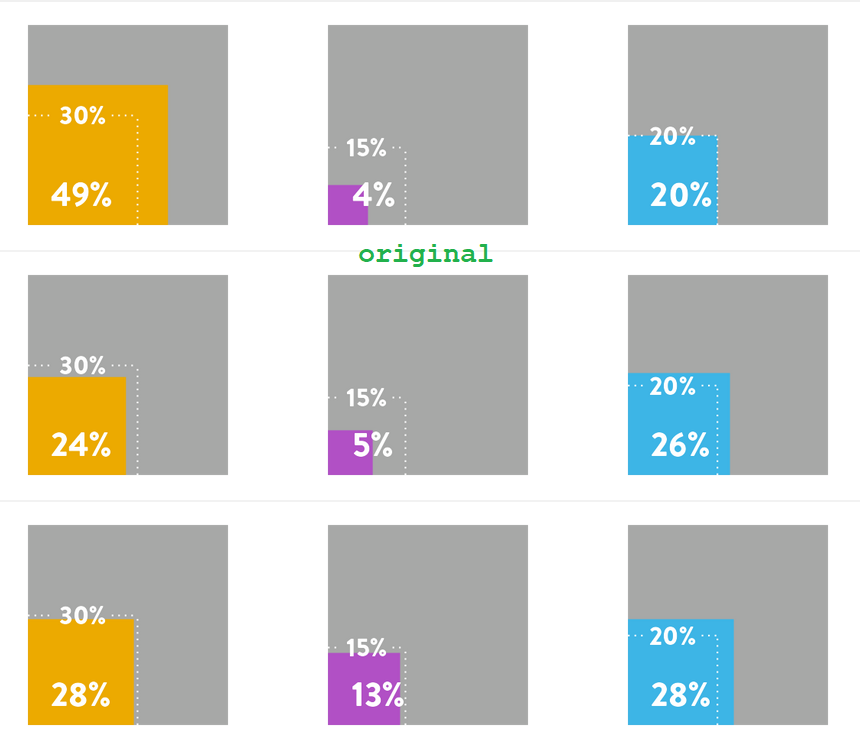
Take these plots. I only want the glow when it’s white text over grey, not black text over white (otherwise we get a fuzzy edge to the black text).

My solution: change the blur amount (to nothing) programmatically.

Code snippet for a data visualisation using ggplot2 in R. It calculates x-coordinates and formats text boxes. Parameters for text colour, justification, and blur are set based on a variable. Uses 'Brandon Grotesque Regular' font.

One last thing

The eagle-eyed will have noticed I added some glow to the dotted lines. Those are made with a combination of geomtextpath::geom_textsegment and plain old geom_line.

Main “why is this not working”? Line width is controlled by linewidth in geom_textsegment and size in geom_line.

Code snippet illustrates line customisation in a data visualisation. 'geom_segment' uses 'size' for line thickness. 'geom_textsegment' employs 'linewidth' for thickness, while 'size' affects text size. Highlights flexibility in line and text adjustments.

{ggfx} is a really fun package, well worth exploring. Definitely a few “just because you can doesn’t mean you should” options, but it offers really handy tricks for enhancing your existing geoms with subtle effects.

Reuse

Citation

For attribution, please cite this work as:
Thompson, Cara. 2023. “One Solution to Make Text Stand Out Against Most Backgrounds.” January 6, 2023. https://www.cararthompson.com/posts/2023-01-06-creating-a-dataviz-with-smallish/.