library(monochromeR)

generate_palette("purple", modification = "go_lighter",
                 n_colours = 5, view_palette = T)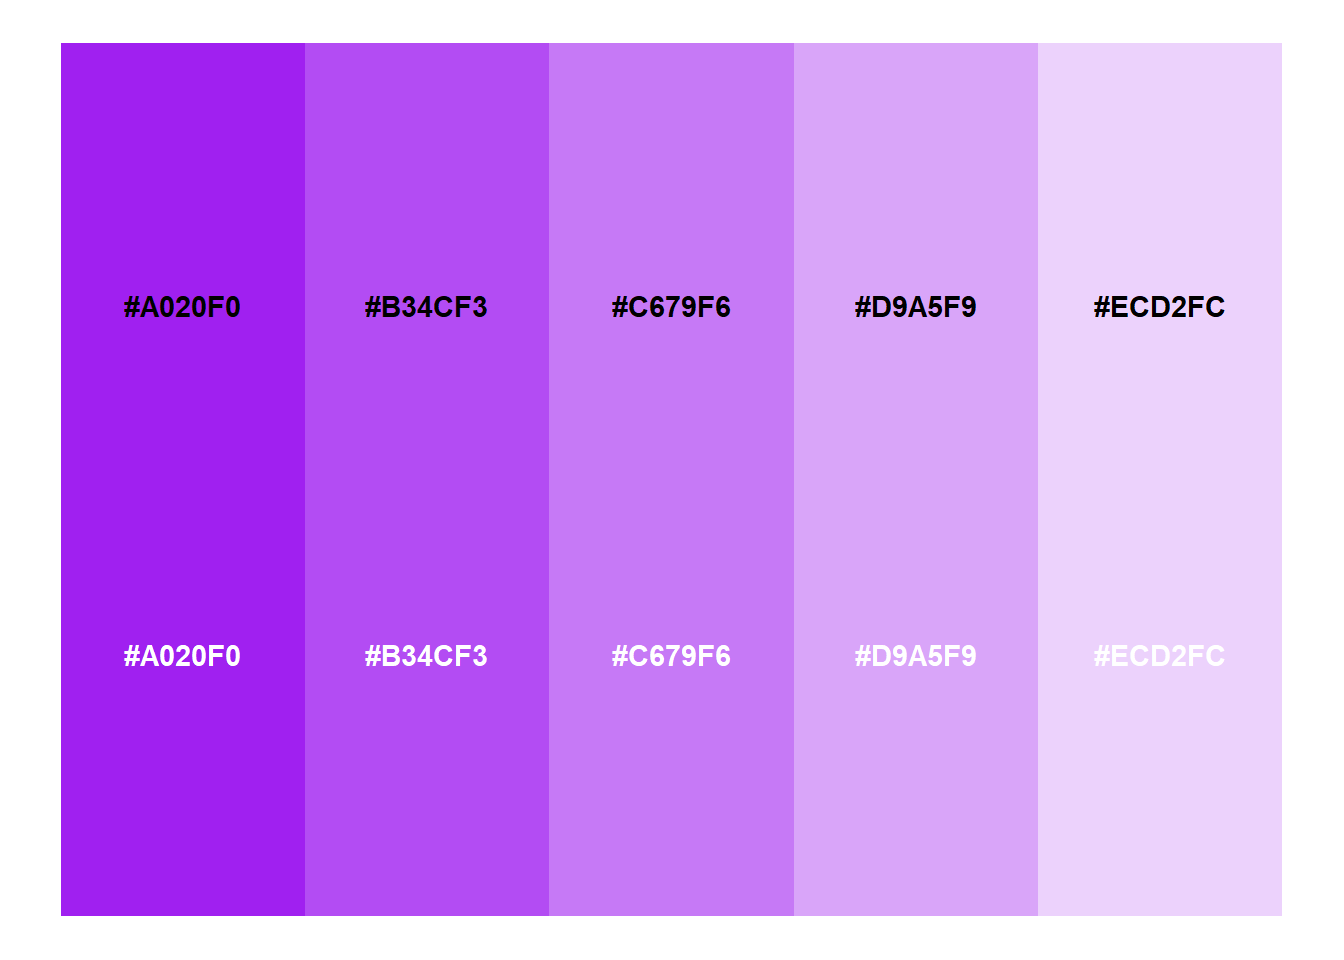
[1] "#A020F0" "#B34CF3" "#C679F6" "#D9A5F9" "#ECD2FC"An R package to easily create, visualise and use monochrome colour palettes
![]()
This package generates a monochrome palette from a starting colour for a specified number of colours. Users can decide whether to go darker, lighter, or both ways from that starting colour, which can be provided as a vector of rgb values (e.g. c(15, 75, 99)), a hex colour code (e.g. #0F4B63) or a recognised colour name (e.g. "purple"). The package can also display the generated palette in the plot window, with or without hex colour code labels.
This package is available on CRAN, so can be installed using install.packages("monochromeR").
Alternatively, to install it from GitHub, use remotes::github_install("cararthompson/monochromeR"). (To do this, you need to have installed the remotes package. To do that, use install.packages("remotes").)
Sure! Here goes. To make the examples easy to read, I will use recognised colour names rather than hex codes or rgb values.
generate_palette()library(monochromeR)
generate_palette("purple", modification = "go_lighter",
n_colours = 5, view_palette = T)
[1] "#A020F0" "#B34CF3" "#C679F6" "#D9A5F9" "#ECD2FC"The functions allow for British spelling and US spelling of colour/color.
generate_palette("purple", modification = "go_darker",
                 n_colors = 5, view_palette = T, view_labels = F)
[1] "#A020F0" "#8019C0" "#601390" "#3F0C5F" "#200630"With more colours, the hex codes get harder to view in the plot. They are printed in the console when the function is called on its own, and can also be assigned to an object for later use.
purple_palette <- generate_palette("purple", modification = "go_both_ways",
                                   n_colours = 20, view_palette = T, view_labels = F)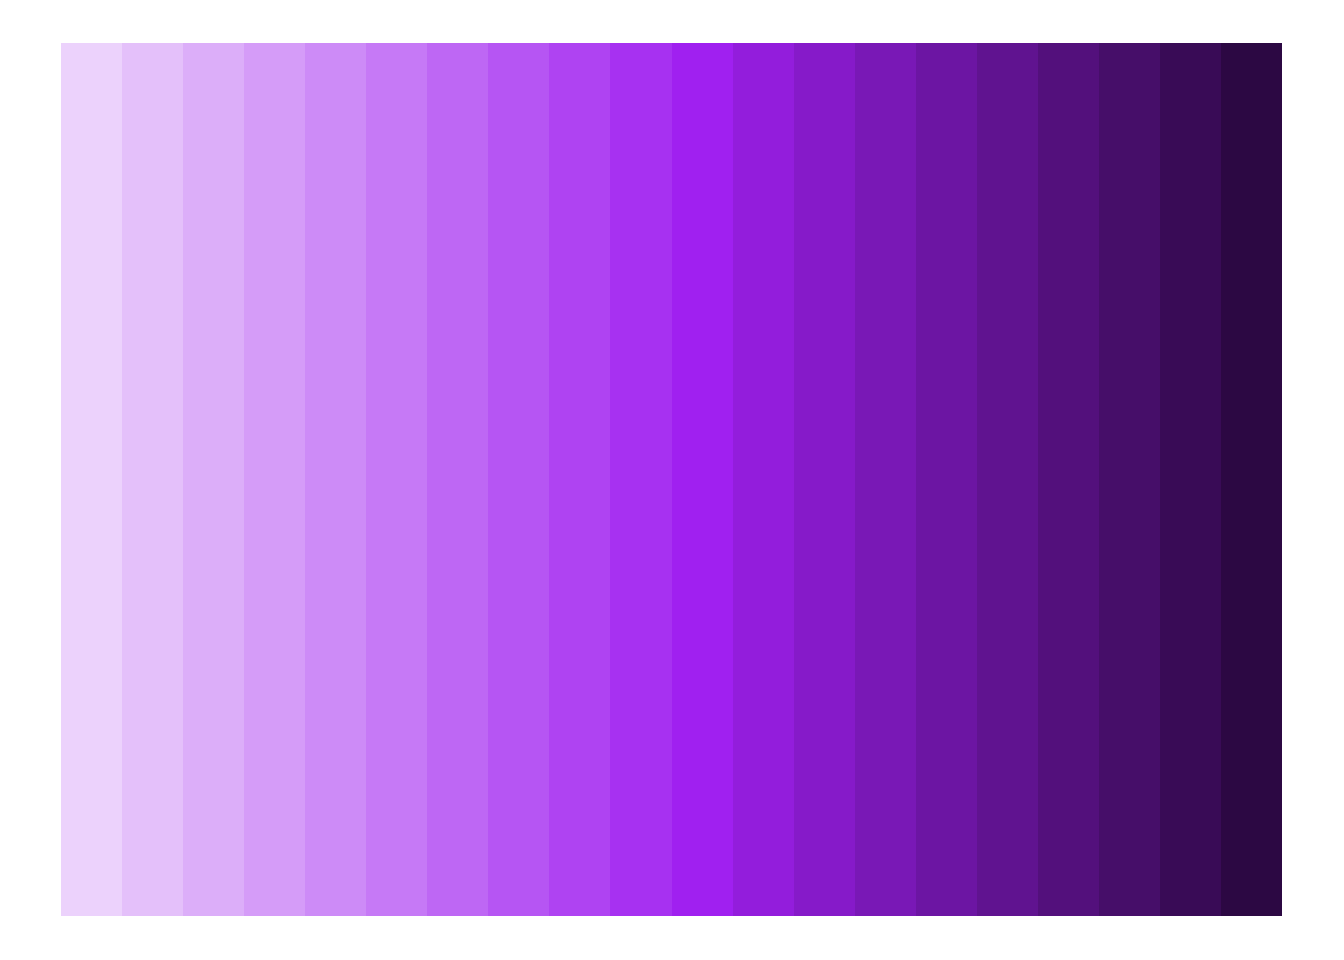
purple_palette [1] "#ECD2FC" "#E4C0FA" "#DCAEF9" "#D59CF8" "#CD8BF7" "#C679F6" "#BE67F4"
[8] "#B655F3" "#AF43F2" "#A731F1" "#A020F0" "#931DDC" "#861AC9" "#7918B6"
[15] "#6C15A3" "#601390" "#53107C" "#460E69" "#390B56" "#2C0843"And just because it was easy to implement, this function can also be used to blend two colours together:
generate_palette("purple", blend_colour = "green",
                 n_colours = 10, view_palette = T, view_labels = F)
 [1] "#A020F0" "#9133DA" "#8347C5" "#755BB0" "#676F9A" "#588385" "#4A9670"
[8] "#3CAA5A" "#2EBE45" "#20D230"# Get hex code from rgb
rgb_to_hex(c(15, 75, 99))[1] "#0F4B63"# Get hex code from rgba
rgba_to_hex(c(15, 75, 99, 0.8))[1] "#3E6E82"view_palette(c("red", "yellow", "purple", "green"), view_labels = F)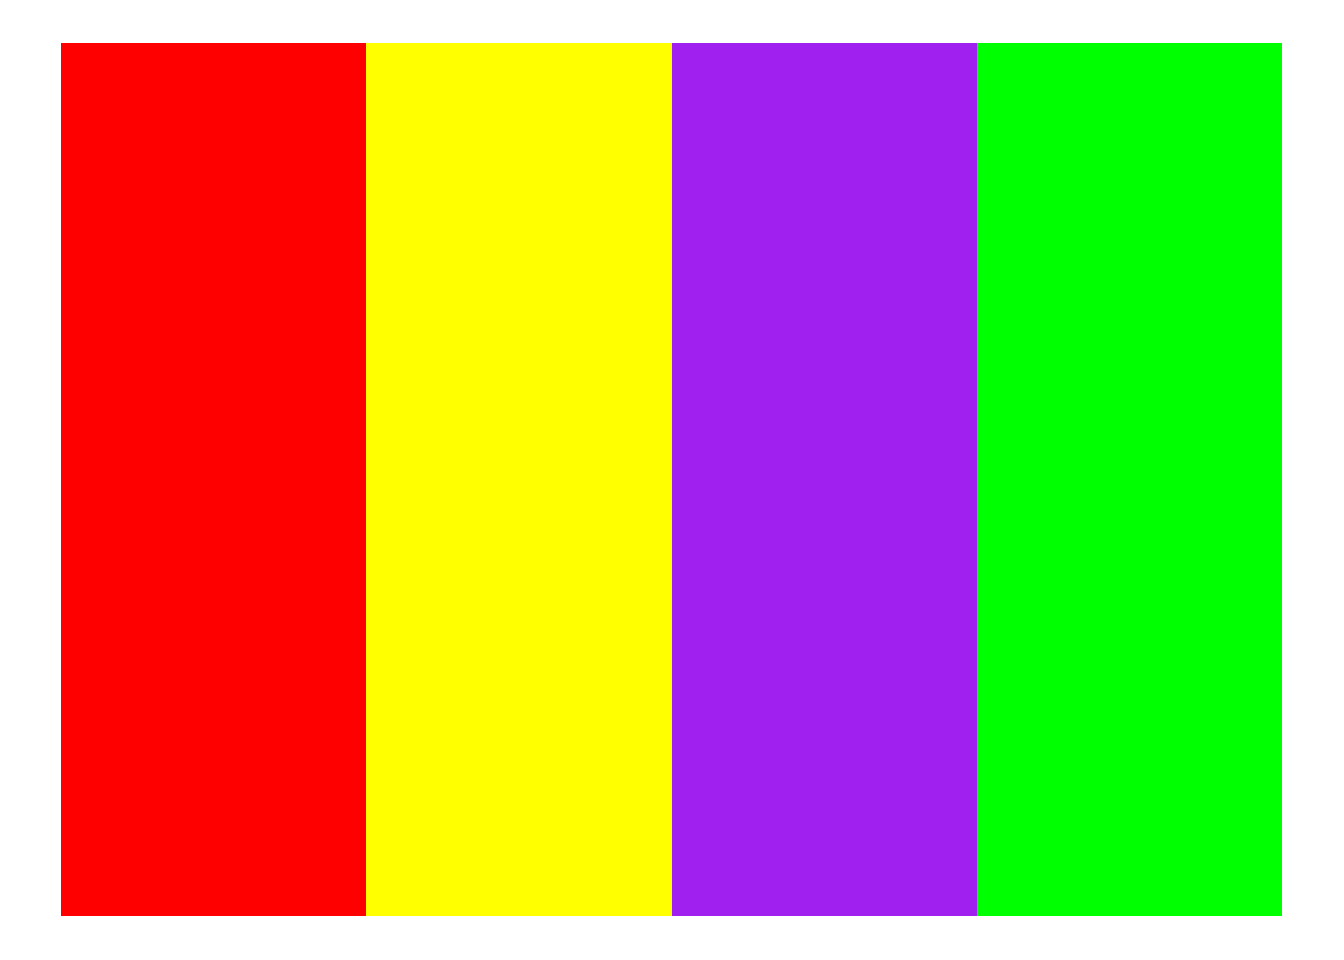
view_palette(c(wesanderson::wes_palettes$Moonrise1,
               wesanderson::wes_palettes$Moonrise2[1:2]))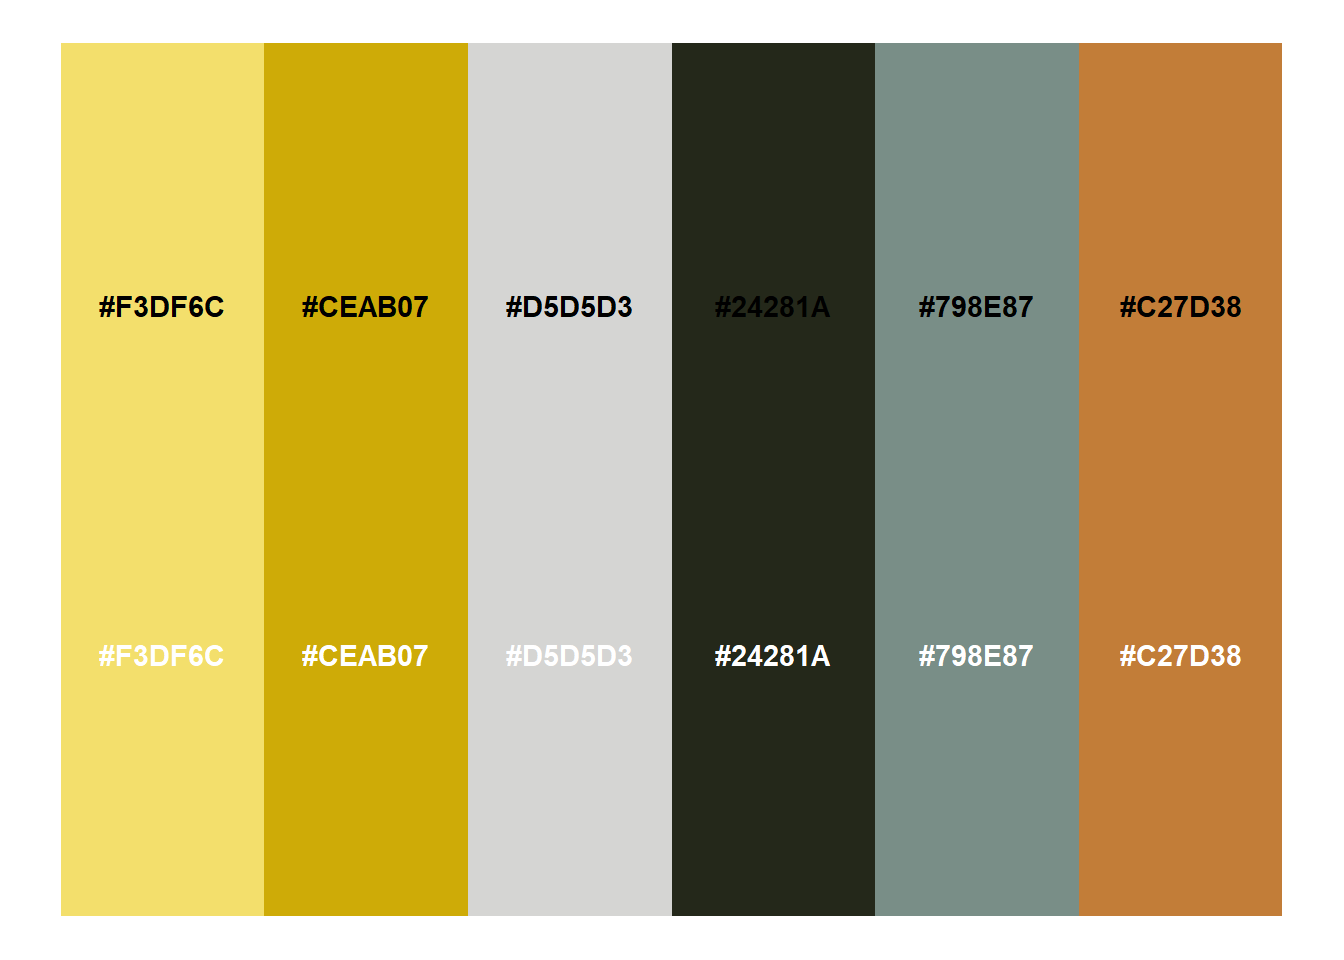
monochromeR within datavisualisationsgenerate_palette within scale_colour_manual()Here’s a simple example, using {monochromeR}’s generate_palette() to create a colour palette on the fly within ggplot().
library(tidyverse)
library(monochromeR)

penguin_plot <- palmerpenguins::penguins %>%
  ggplot() +
  geom_point(aes(x = flipper_length_mm, y = bill_length_mm,
                 colour = species, size = body_mass_g),
             alpha = 0.8) +

  labs(title = "Perfectly proportional penguins",
       subtitle = "\nEach dot represents a penguin. The bigger the dot, the heavier the penguin. \nLook at them go!",
       x = "Flipper length (mm)",
       y = "Bill length (mm)") +
   scale_size(guide = "none") +
 guides(colour = guide_legend(title = "")) +
  theme_minimal()

penguin_plot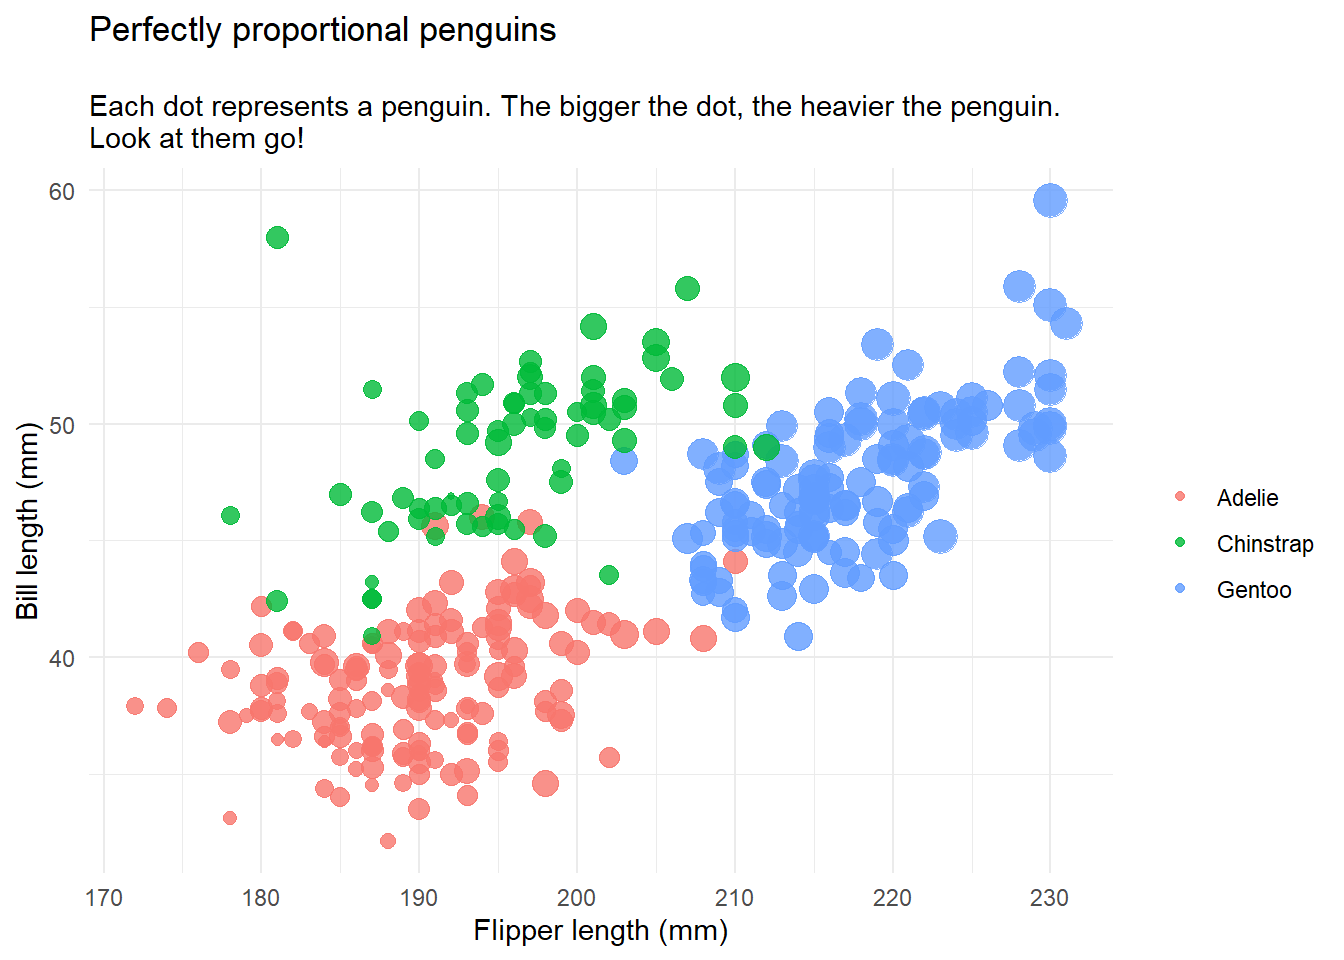
penguin_plot <- penguin_plot +
 scale_colour_manual(values = generate_palette(c(15, 75, 99),
                                    modification = "go_both_ways",
                                    n_colours = 3))

penguin_plot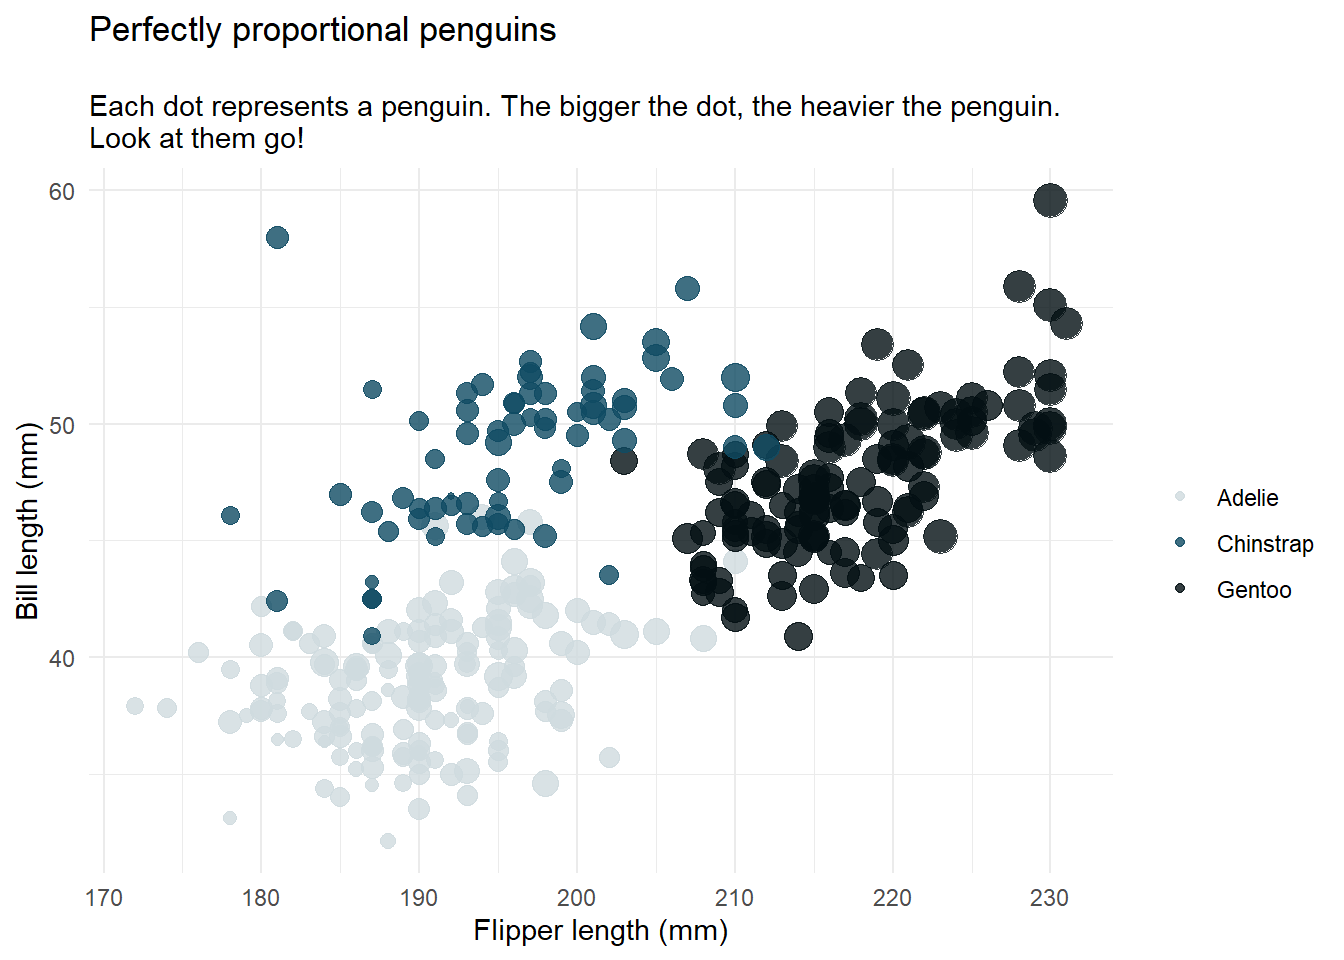
Here’s an example using {monochromeR}’s generate_palette() to generate all the colours used in the plot, resulting in a more polished look with minimal effort.
penguin_palette <- generate_palette(c(15, 75, 99),
                                    modification = "go_both_ways",
                                    n_colours = 8,
                                    view_palette = T,
                                    view_labels = F)
penguin_plot +
  theme_minimal() %+replace%
    theme(plot.background = element_rect(fill = penguin_palette[8],
                                         colour = penguin_palette[8]),
          panel.grid = element_line(colour = penguin_palette[7]),
          panel.background = element_rect(fill = penguin_palette[8],
                                          colour = penguin_palette[8]),
          text = element_text(colour = penguin_palette[3]),
          axis.text = element_text(colour = penguin_palette[3]),
          plot.title = element_text(colour = penguin_palette[1], hjust = 0, size = 16),
          plot.subtitle = element_text(colour = penguin_palette[2], hjust = 0))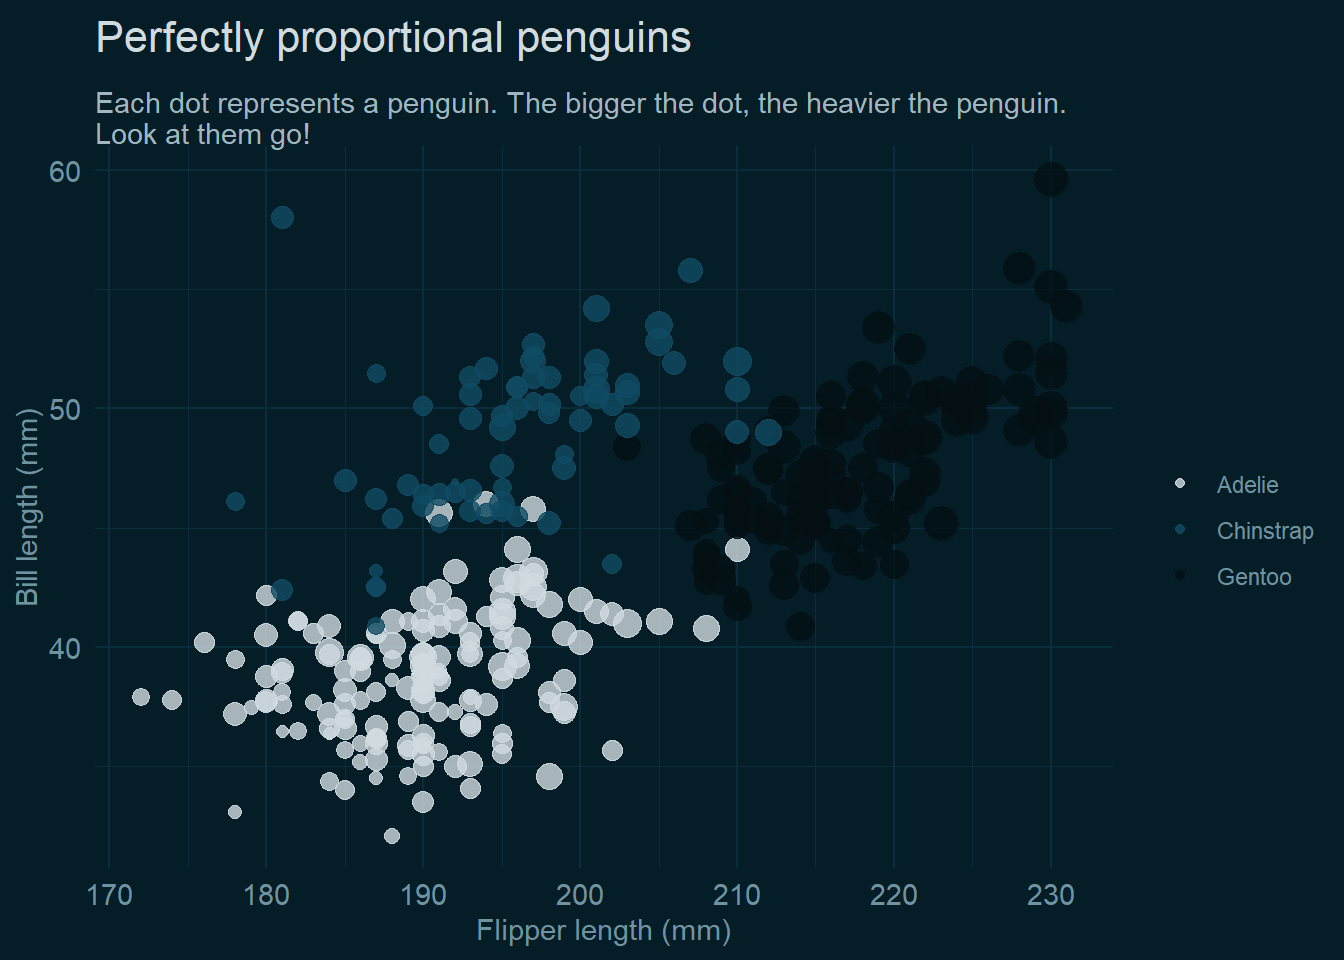
I’ve done my best to make the functions in this package user-friendly, and to make the error messages easy to understand. If you come across a bug or an error message that doesn’t make sense, or if there’s something you think would make this package better, please let me know!