# Here are the libraries we'll be using ----
# |- For creating our plot ----
install.packages("palmerpenguins")
install.packages("tidyverse")

# |- For tidying data ----
install.packages("janitor")

# |- For manipulating colours and adding text hierarchy ----
install.packages("monochromeR")

# |- For working with fonts ----
install.packages("ragg")

# |- For creating annotations ----
install.packages("ggtext")

# |- For taking a quick look at points we want to annotate ----
install.packages("plotly")Level Up Your Plots: A Code-along Workshop
Online Workshop @ NHS-R 2022 Conference - November, 2022
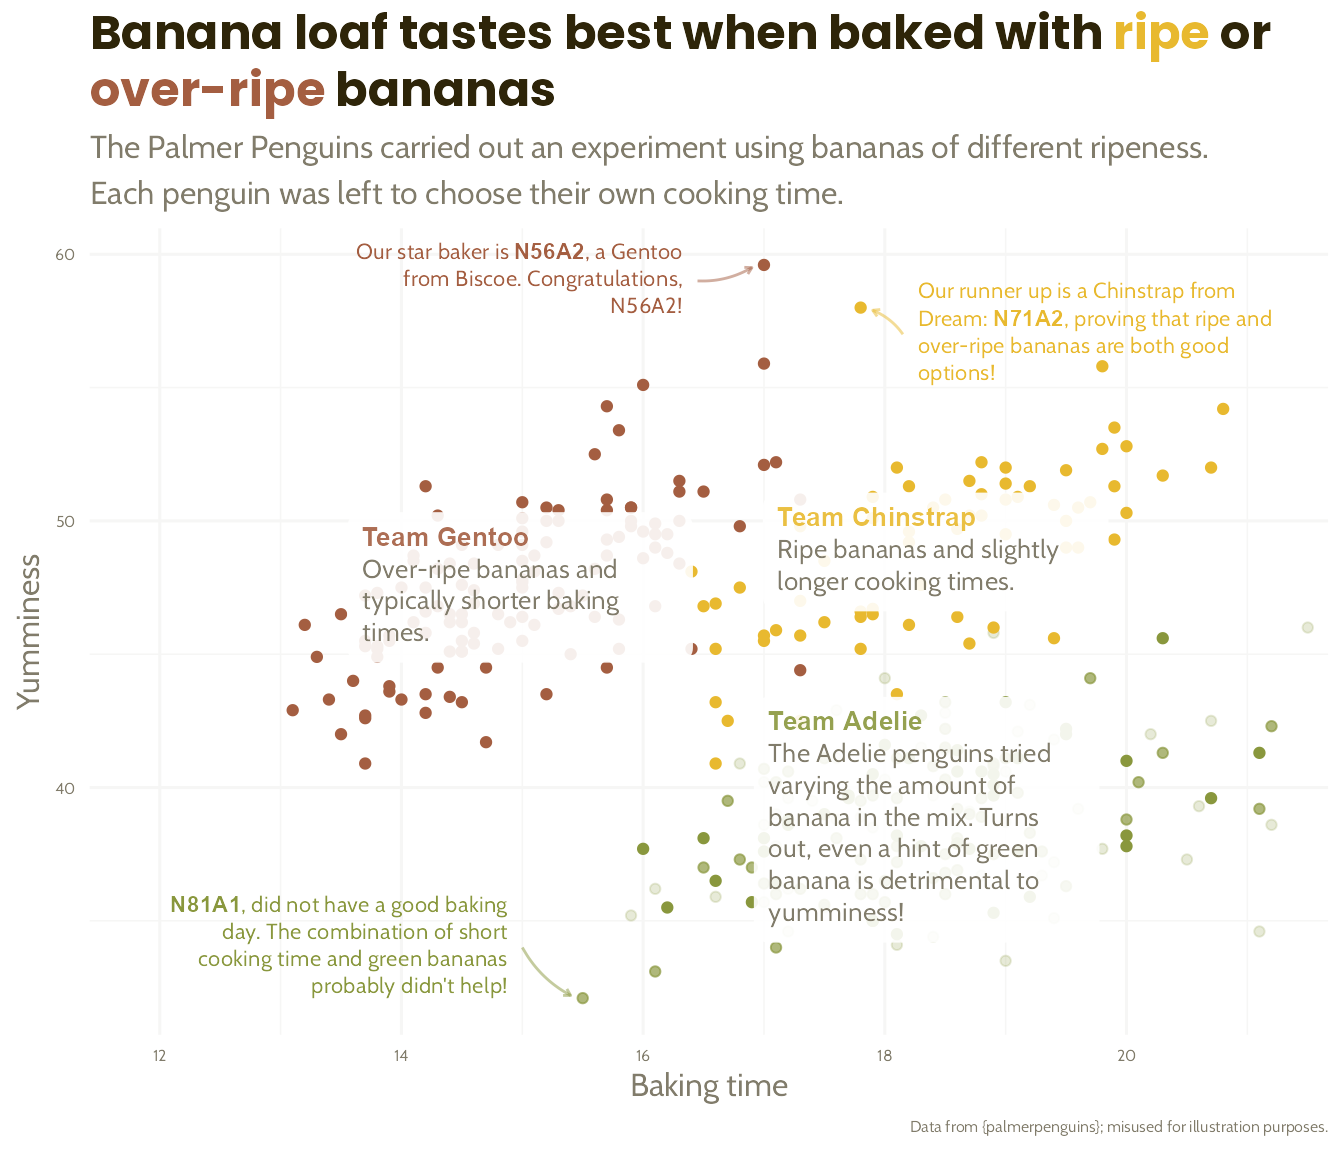
In this 3-hour workshop, we live coded our way together from a basic plot about the penguins to this. To code along, either watch the video or work your way through the slide in which I retraced our steps at your own pace. Happy plotting!
Recording
Slides
Full code
To get the code to work, first you’ll need to install a few packages…
Then you’ll need to set up the font variant I used. Here, I’m poinging the code to where I had stored the font relative to the project. You can use whatever path you like. The font file is available along with the full set of project files here.
systemfonts::register_font(name = "Poppins",  # You can call it whatever you like
                           # This is the path to the font I have already uploaded
                           plain = "fonts/Poppins-Bold.ttf")
Here’s the code we ended up with by the end of the workshop. Feel free to reuse as much of it as you like for your own projects!
# Libraries ----
library(tidyverse)

# Fonts ----
# Registering a variant
# First, download the font file the font file to the project using the "Files" tab.
# Then call systemfonts::register_font() as in the example below
systemfonts::register_font(name = "Poppins",
                           # This is the path to the font I have already uploaded
                           plain = "fonts/Poppins-Bold.ttf")

# Data ----
penguins <- palmerpenguins::penguins %>%
  filter(!is.na(bill_length_mm)) %>%
  mutate(banana_quantity = case_when(species == "Adelie" & island == "Biscoe" ~ 1,
                                     species == "Adelie" & island == "Dream" ~ 0.5,
                                     species == "Adelie" & island == "Torgersen" ~ 0.1,
                                     TRUE ~ 1))

# |- Summaries ----
penguin_summaries <- palmerpenguins::penguins %>%
  group_by(species) %>%
  summarise(bill_depth_mm = mean(bill_depth_mm, na.rm = TRUE),
            bill_length_mm = mean(bill_length_mm, na.rm = TRUE)) %>%
  mutate(commentary = case_when(species == "Adelie" ~
                                  "The Adelie penguins tried varying the amount of banana in the mix.
                                Turns out, even a hint of green banana is detrimental to yumminess!",
                                species == "Gentoo" ~
                                  "Over-ripe bananas and typically shorter baking times.",
                                TRUE ~ "Ripe bananas and slightly longer cooking times."))

# |- Highlights ----
penguin_highlights <- palmerpenguins::penguins_raw %>%
  janitor::clean_names() %>%
  rename(bill_depth_mm = culmen_depth_mm,
         bill_length_mm = culmen_length_mm) %>%
  filter(bill_length_mm %in% c(max(bill_length_mm, na.rm = TRUE),
                               sort(bill_length_mm, decreasing = TRUE)[2],
                               min(bill_length_mm, na.rm = TRUE))) %>%
  mutate(species = gsub("(.) (.*)", "\\1", species),
         commentary = case_when(bill_length_mm == max(bill_length_mm) ~
                                  paste0("Our star baker is **", individual_id,
                                         "**, a ", species, " from ", island,
                                         ". Congratulations, ", individual_id, "!"),
                                bill_length_mm == sort(bill_length_mm, decreasing = TRUE)[2] ~
                                  paste0("Our runner up is a ", species,
                                         " from ", island, ": **", individual_id,
                                         "**, proving that ripe and over-ripe bananas are both good options!"),
                                TRUE ~ paste0("**", individual_id,
                                              "**, did not have a good baking day. The combination of short cooking time and green bananas probably didn't help!"))) %>%
  arrange(bill_length_mm) %>%
  mutate(label_x = c(15, 18.15, 16.45),
         label_y = c(34, 57, 59),
         left_to_right = case_when(label_x < bill_depth_mm ~ 1,
                                   TRUE ~ 0),
         arrow_x_end = case_when(label_x < bill_depth_mm ~ bill_depth_mm - 0.1,
                                 TRUE ~ bill_depth_mm + 0.1),
         arrow_y_end = case_when(label_y < bill_length_mm ~ bill_length_mm - 0.1,
                                 TRUE ~ bill_length_mm + 0.1))


# Colour scheme ----
banana_colours <- list("Adelie" = "#89973d",
                       "Chinstrap" = "#e8b92f",
                       "Gentoo" = "#a45e41")

dark_text <- monochromeR::generate_palette(banana_colours$Chinstrap,
                                           "go_darker",
                                           n_colours = 2)[2]

light_text <- monochromeR::generate_palette(dark_text,
                                            "go_lighter",
                                            n_colours = 3)[2]

banana_colours <- list("Adelie" = "#89973d",
                       "Chinstrap" = "#e8b92f",
                       "Gentoo" = "#a45e41",
                       "light_text" = light_text,
                       "dark_text" = dark_text)

# Plot ----
basic_plot <- ggplot(penguins,
                     aes(x = bill_depth_mm,
                         y = bill_length_mm,
                         colour = species)) +
  geom_point(aes(alpha = banana_quantity)) +
  scale_alpha(range = c(0.2, 1),
              breaks = c(0.1, 0.5, 1)) +
  labs(title = "Banana loaf tastes best when baked with ripe or over-ripe bananas",
       subtitle = "The Palmer Penguins carried out an experiment using bananas of different ripeness.
The Adelie penguins were given unripe bananas, Gentoos were given over-ripe
bananas and Chinstraps were given yellow bananas.
Each penguin was left to choose their own cooking time.",
       x = "Baking time",
       y = "Yumminess",
       caption = "Data from {palmerpenguins}; misused for illustration purposes.") +
  theme_minimal(base_size = 12)

# |- Level up! ----
basic_plot +
  scale_colour_manual(values = banana_colours,
                      limits = force) +
  labs(title = paste0("Banana loaf tastes best when baked with ",
                      "<span style=\"color:", banana_colours$Chinstrap,
                      "\">**ripe**</span> or<br><span style=\"color:",
                      banana_colours$Gentoo, "\">**over-ripe**</span> bananas"),
       subtitle = "The Palmer Penguins carried out an experiment using bananas of different ripeness.
Each penguin was left to choose their own cooking time.") +
  ggtext::geom_textbox(data = penguin_summaries,
                       aes(label = paste0("**Team ", species, "**",
                                          "<br><span style = \"color:",
                                          banana_colours$light_text,
                                          "\">", commentary, "</span>")),
                       family = "Cabin",
                       size = 3.5,
                       width = unit(9, "line"),
                       alpha = 0.9,
                       box.colour = NA) +
  ggtext::geom_textbox(data = penguin_highlights,
                       aes(x = label_x,
                           y = label_y,
                           label = commentary,
                           hjust = left_to_right,
                           halign = left_to_right),
                       family = "Cabin",
                       size = 3,
                       fill = NA,
                       box.colour = NA) +
  geom_curve(data = penguin_highlights,
             aes(x = label_x, xend = arrow_x_end,
                 y = label_y, yend = arrow_y_end),
             curvature = 0.15,
             arrow = arrow(length = unit(0.1, "cm")),
             alpha = 0.5) +
  scale_x_continuous(expand = expansion(mult = c(0.2, 0.02))) +
  theme(text = element_text(colour = banana_colours$light_text,
                            family = "Cabin",
                            lineheight = 1.2),
        plot.title = ggtext::element_markdown(colour = banana_colours$dark_text,
                                              family = "Poppins",
                                              size = 18),
        axis.text = element_text(size = 6, colour = banana_colours$light_text),
        plot.caption = element_text(size = 6),
        panel.grid = element_line(colour = "#F6F6F5"),
        legend.position = "none")

# Export ----
ggsave(filename = "penguin-bakeoff.png",
       width = 8, height = 7.5, dpi = 400,
       bg = "#FFFFFF")
Reuse
Citation
For attribution, please cite this work as:
Thompson, Cara. 2022. “Level Up Your Plots: A Code-Along
Workshop.” November 5, 2022. https://www.cararthompson.com/talks/nhsr2022-level-up.